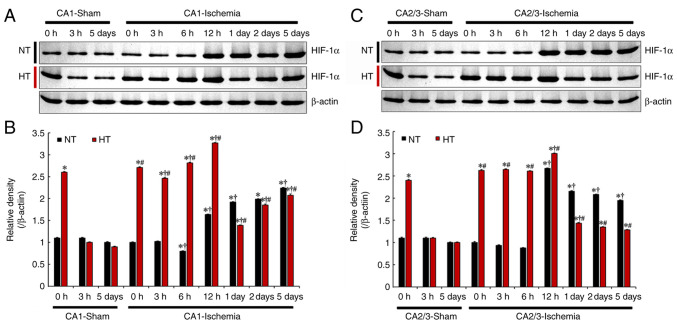
Figure 4.
(A and C) Western blot analysis of HIF-1α in CA1 (A) and CA2/3 (C) of the NT/sham, NT/ischemia, HT/sham, and HT/ischemia groups at 0, 3, 6 and 12 h, 1, 2 and 5 days after TFI. (B and D) Relative density of the immunoblot bands is represented. Protein levels of HIF-1α normalized to β-actin in CA1 (B) and CA2/3 (D) *P<0.05 vs. NT/sham group at 0 h; †P<0.05 vs. pre-time point group; #P<0.05 vs. NT/ischemia group. The bars indicate the means ± SEM (n=5, respectively). HIF-1α, hypoxia-inducible factor 1α; NT, normothermia; HT, hyperthermia; TFI, transient forebrain ischemia.

