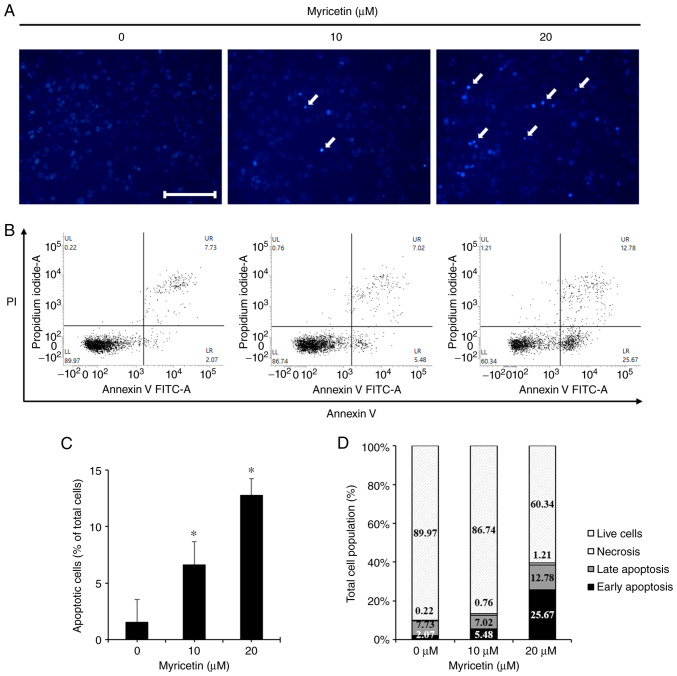
Figure 2.
Myricetin induces apoptotic cell death in SK-BR-3 cells. (A) Fluorescence microscopic images of SK-BR-3 cells treated with myricetin (10 and 20 µM for 24 h) and stained with DAPI. The arrows indicate chromatin condensation in SK-BR-3 cells. Scale bar, 10 µm. (B) Flow cytometry results of SK-BR-3 cells treated with myricetin (10 and 20 µM for 24 h) and were stained with Annexin V/PI. (C) The bar graph represents the apoptotic bodies (% of total cells). (D) Total cell population (%) in groups treated with 0, 10, and 20 µM of myricetin. The control group (0 µM) was treated with the same amount of DMSO. Data are displayed as the mean ± SD (n=3). *P<0.05 vs. control group. DAPI, 4′, 6-diamidino-2-phenylindole; PI, propidium iodide; DMSO, dimethyl sulfoxide.

