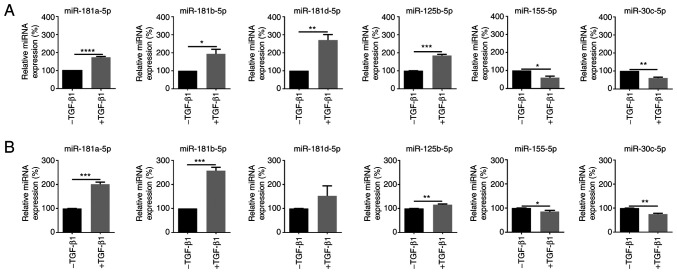
Figure 1.
Quantitative PCR validation of miRNA expression in the renal cell carcinoma cell lines. miRNA expression in (A) 786-O and (B) Caki-2 cells following treatment with TGF-β1. The plots show results from three independent biological experiment performed in triplicate. *P<0.05, **P<0.01, ***P<0.001, ****P<0.0001. miRNA, microRNA.

