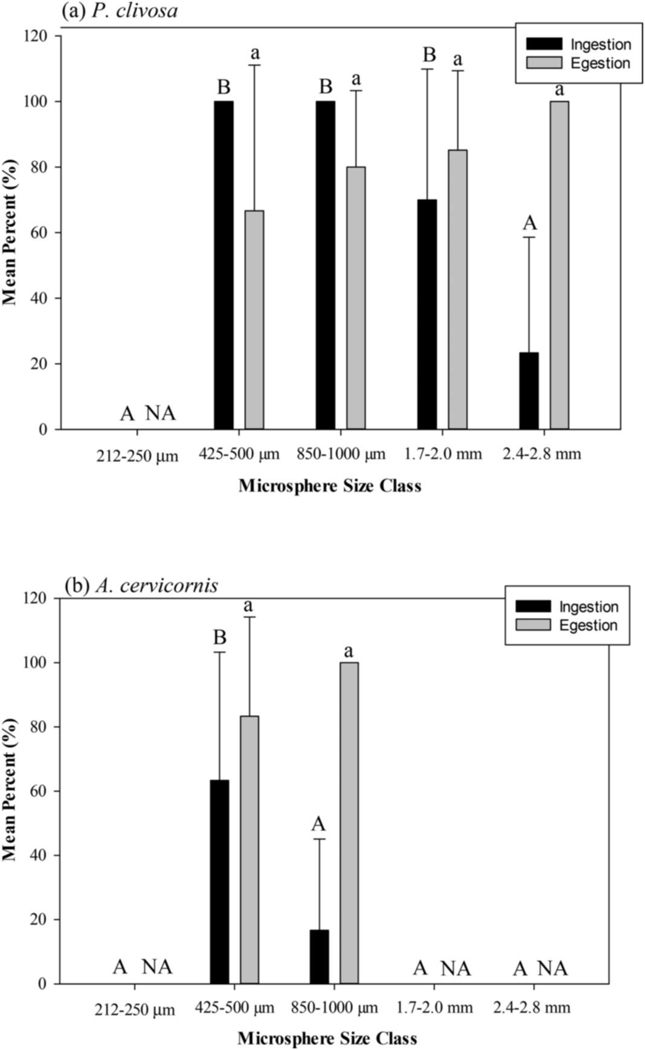
Fig. 1.
Mean percent with standard deviation of ingested and egested microspheres in (a) Pseudodiploria clivosa and (b) Acropora cervicornis. Capital letters indicate significant difference between ingested size classes (Tukey’s post-hoc). Lower case letters indicate significant difference between egested size classes (Tukey’s post-hoc). NA = not applicable. Note: mechanism for lack of ingestion for A. cervicornis not the same for all size classes, as described in results.

