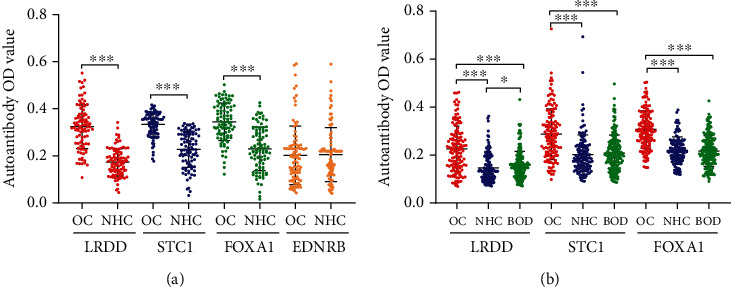
Figure 1.

Scatter plots of the optical density (OD) value for autoantibodies in the research and validation group. (a) research group (b) validation group. ∗∗∗P < 0.001, ∗P < 0.05. OC: ovarian cancer; NHC: normal healthy control; BOD: benign ovarian diseases. Lines represented median and quartile range.
