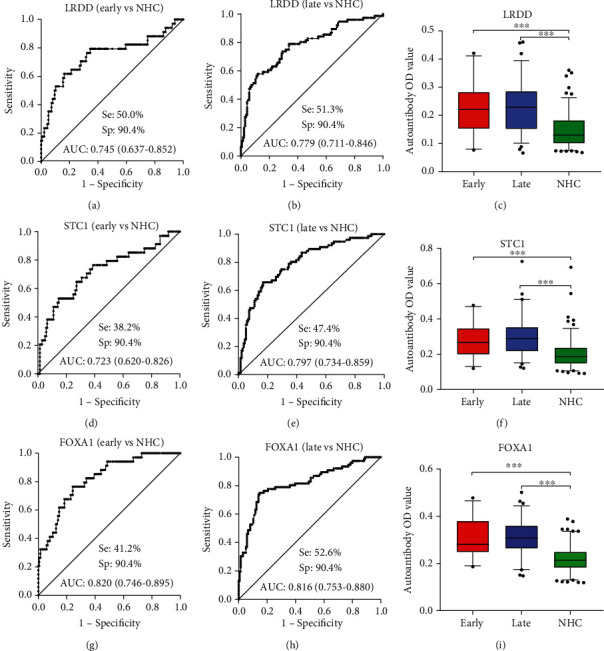
Figure 4.

Diagnostic performances of autoantibodies against LRDD, STC1, and FOXA1 for the discrimination of NHC and patients with early-stage or late stage. Box plots present the autoantibodies OD value among early stage, late-stage, and NHC in the validation group. The lines on the boxes represent 95, 75, 50, 25, and 5 percentiles from top to bottom. Whiskers show points greater than 95% quantile and less than 5% quantile; ∗∗∗P < 0.001. NHC: normal healthy control; Se: sensitivity; Sp: specificity; AUC: area under the receiver operating characteristic curve.
