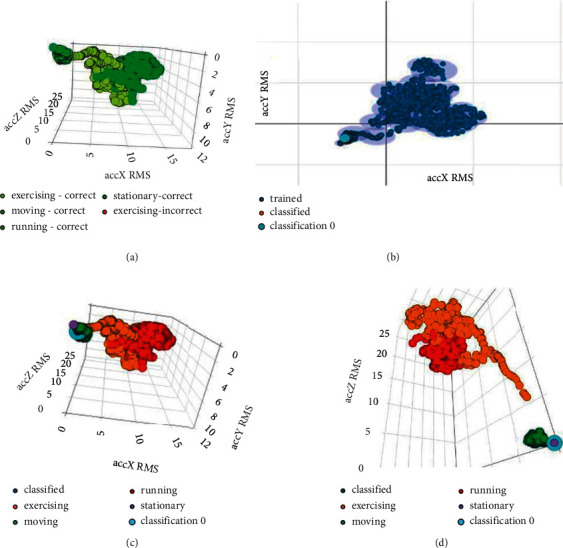
Figure 9.

(a) Feature explorer (physical activity model), (b) anomaly explorer (physical activity model), (c) spectral features (3,001 samples) for X-, Y-, and Z-axis (“moving” label), and (d) spectral features (3,001 samples) for X-, Y-, and Z-axis (“stationary” label).
