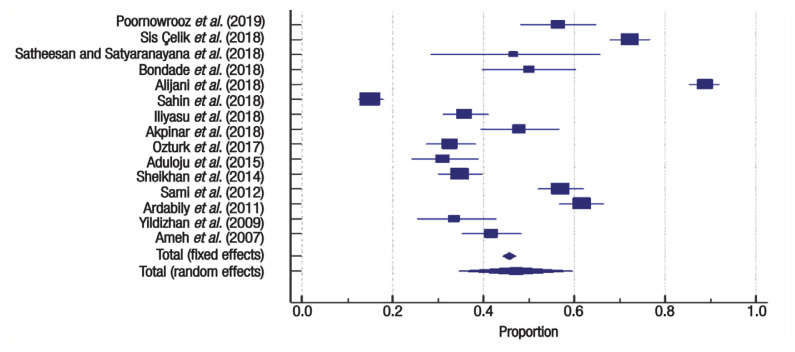
Table 3.
Forest plot showing the prevalence of total domestic violence against infertile women according–the fixed and random effects models (N = 15)
| Author (year of publication) | Total sample size | Proportion of DV in % | 95% CI | Weight in % | |
|---|---|---|---|---|---|
| Fixed | Random | ||||
| Poornowrooz et al.27 (2019) | 147 | 56.463 | 48.046–64.613 | 3.36 | 6.65 |
| Sis Çelik et al.32 (2018) | 423 | 72.340 | 67.813–76.552 | 9.62 | 6.77 |
| Satheesan and Satyaranayana43 (2018) | 30 | 46.667 | 28.342–65.674 | 0.70 | 6.04 |
| Bondade et al.35 (2018) | 100 | 50.000 | 39.832–60.168 | 2.29 | 6.57 |
| Alijani et al.28 (2018) | 379 | 88.918 | 85.317–91.896 | 8.62 | 6.76 |
| Sahin et al.34 (2018) | 774 | 14.987 | 12.545–17.699 | 17.58 | 6.79 |
| Iliyasu et al.39 (2018) | 373 | 35.925 | 31.051–41.025 | 8.48 | 6.76 |
| Akpinar et al.33 (2017) | 142 | 47.887 | 39.440–56.424 | 3.24 | 6.64 |
| Ozturk et al.45 (2017) | 301 | 32.558 | 27.293–38.170 | 6.85 | 6.74 |
| Aduloju et al.38 (2015) | 170 | 31.176 | 24.304–38.719 | 3.88 | 6.67 |
| Sheikhan et al.20 (2014) | 400 | 34.750 | 30.087–39.641 | 9.10 | 6.76 |
| Sami et al.46 (2012) | 400 | 57.000 | 51.987–61.909 | 9.10 | 6.76 |
| Ardabily et al.16 (2011) | 400 | 61.750 | 56.790–66.535 | 9.10 | 6.76 |
| Yildizhan et al.18 (2009) | 122 | 33.607 | 25.310–42.720 | 2.79 | 6.61 |
| Ameh et al.15 (2007) | 233 | 41.631 | 35.230–48.248 | 5.31 | 6.71 |
| Total (fixed effects) | 4,394 | 45.610 | 44.132–47.094 | 100.00 | 100.00 |
| Total (random effects) | 4,394 | 47.163 | 34.660–59.850 | 100.00 | 100.00 |

| |||||
