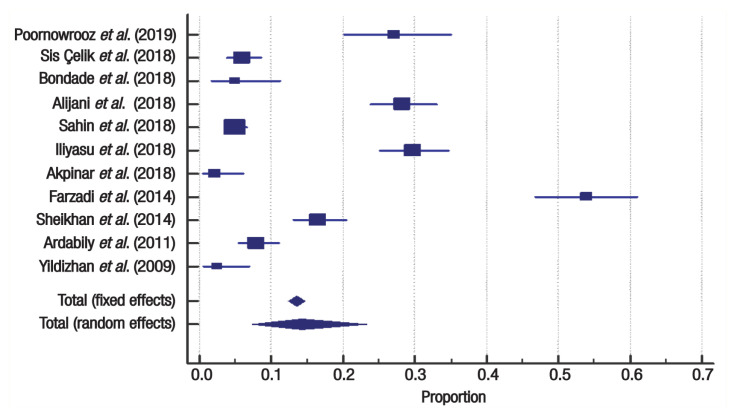
Table 6.
Forest plot showing the prevalence of domestic sexual violence against infertile women (n = 11)
| Author (year of publication) | Total sample size | Proportion of domestic sexual violence in % | 95% CI | Weight in % | |
|---|---|---|---|---|---|
| Fixed | Random | ||||
| Poornowrooz et al.27 (2019) | 147 | 27.211 | 20.205–35.159 | 4.26 | 8.96 |
| Sis Çelik et al.32 (2018) | 423 | 5.910 | 3.861–8.601 | 12.22 | 9.22 |
| Bondade et al.35 (2018) | 100 | 5.000 | 1.643–11.283 | 2.91 | 8.79 |
| Alijani et al.28 (2018) | 379 | 28.232 | 23.754–33.054 | 10.95 | 9.21 |
| Sahin et al.34 (2018) | 774 | 4.910 | 3.497–6.677 | 22.33 | 9.29 |
| Iliyasu et al.39 (2018) | 373 | 29.759 | 25.162–34.680 | 10.77 | 9.20 |
| Akpinar et al.33 (2017) | 142 | 2.113 | 0.438–6.050 | 4.12 | 8.95 |
| Farzadi et al.30 (2014) | 200 | 54.000 | 46.828–61.052 | 5.79 | 9.07 |
| Sheikhan et al.20 (2014) | 400 | 16.500 | 12.997–20.508 | 11.55 | 9.21 |
| Ardabily et al.16 (2011) | 400 | 8.000 | 5.536–11.106 | 11.55 | 9.21 |
| Yildizhan et al.18 (2009) | 122 | 2.459 | 0.510–7.018 | 3.54 | 8.88 |
| Total (fixed effects) | 3,460 | 13.514 | 12.393–14.697 | 100.00 | 100.00 |
| Total (random effects) | 3,460 | 14.289 | 7.206–23.281 | 100.00 | 100.00 |

| |||||
