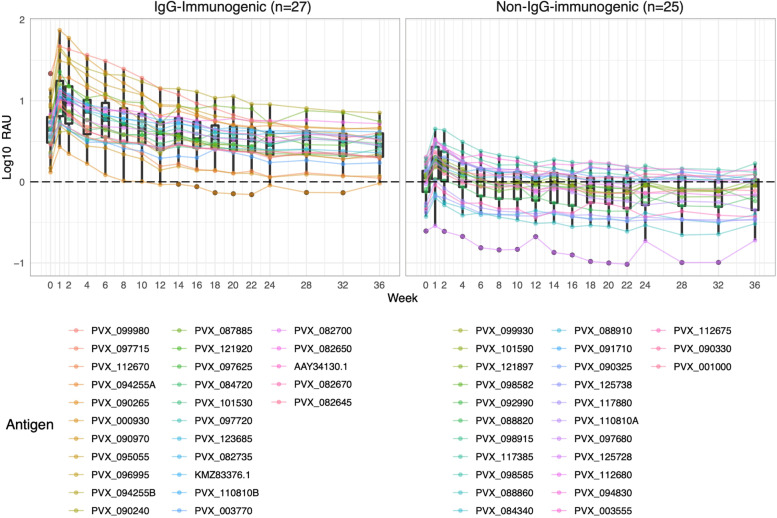
Fig. 2.
Comparison of adjusted total IgG kinetic profiles between IgG-immunogenic and non-IgG-immunogenic P. vivax antigens in 34 Thai patients with symptomatic P. vivax infections. Antigen-specific IgG antibody responses were measured against 52 P. vivax antigens for 9 months following a symptomatic P. vivax infection among all patients from western Thailand. The antibody responses were converted to arbitrary relative antibody units (RAU) from median fluorescent intensity (MFI) and adjusted against the median negative control baseline by subtraction. Each line and colour represent one P. vivax antigen and its specific antibody kinetics following exposure. Negative control panels consist of malaria-free individuals from 3 sources: Australian Red Cross (n = 100), Thai Red Cross (n = 72) and Volunteer Blood Donor Registry (n = 102). Antigens with antibody responses 1 SD above the median negative control baseline at 1-week post-infection were classified as “IgG-immunogenic”. Dots show the median of the 34 patients for each protein, box plots show the median and range of all proteins combined

