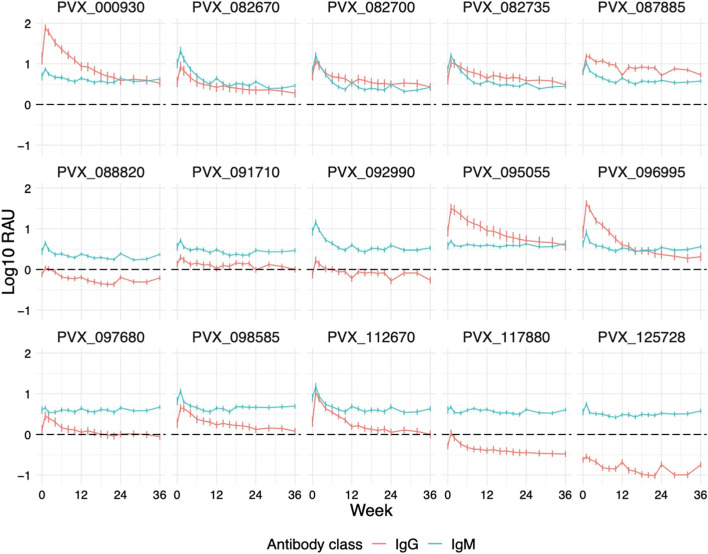
Fig. 4.
Comparison of adjusted total IgG and IgM against 15 P. vivax antigens following symptomatic infections. Fifteen antigens with IgM positivity at 1-week post-infection (> 2 SD above baseline median) were selected, and their IgM responses over a 9-month period were measured and compared to total IgG responses plotted on the same scale. Each line and colour represent an antibody class (either IgG or IgM) and its specific antibody kinetics following exposure. Data were adjusted by subtracting the median of pooled negative control panels (n = 274). Data are expressed as the median ± 95% CI

