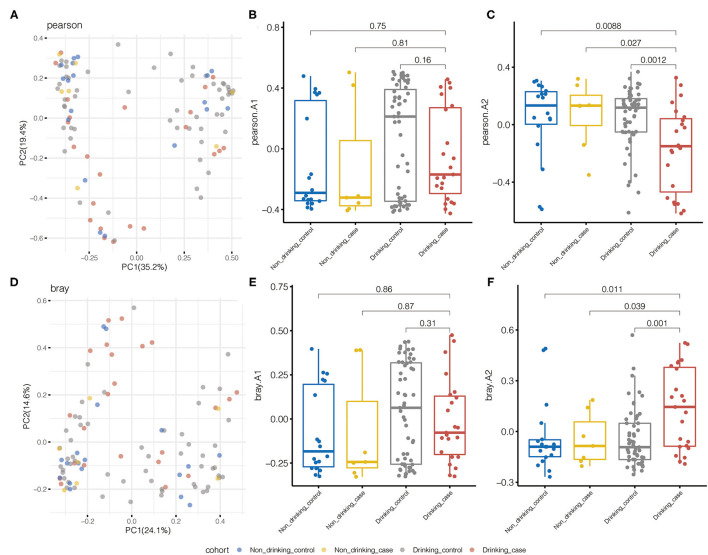
Figure 3.
Pearson distance and Bray–Curtis distance illustrated significant differences in the microbial community for species beta diversity. (A) Principal coordinate analysis (PCOA) diagram by the Pearson distance. (B,C) The first and second principal components based on the Pearson distance. (D) PCOA diagram by Bray–Curtis distance. (E,F) The first and second principal components are based on the Bray–Curtis distance.

