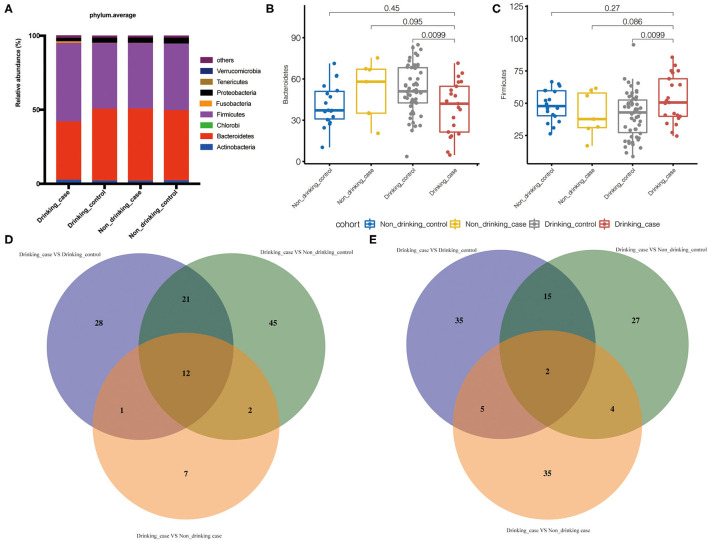
Figure 4.
Differential gut microbiota in the drinking case group. (A) The average compositions and relative abundance at phylum level of the four groups; (B,C) the abundance of phyla Bacteroidetes and Firmicutes in the four groups; and (D,E) the statistically differential overlaps in the distribution of gut microbiome metabolic pathways and species.

