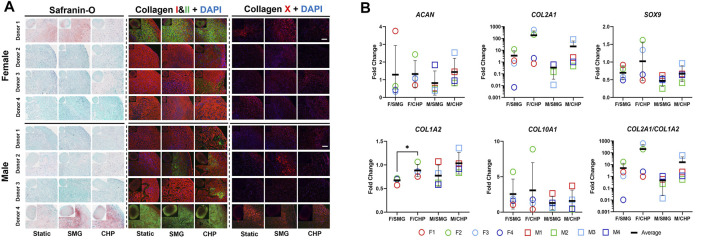
FIGURE 3.
Effect of CHP and SMG on the chondrogenic and hypertrophic differentiation potential of female and male donors. (A) Histological and immunofluorescent staining analysis. (B) Regulation of selected genes expression level. Gene expression level of individual samples were measured by RT-qPCR. Fold change of expression level was calculated by normalizing expression level in the CHP or SMG group to its corresponding static group. Scale bar: 100 μm *Represents p < 0.05.

