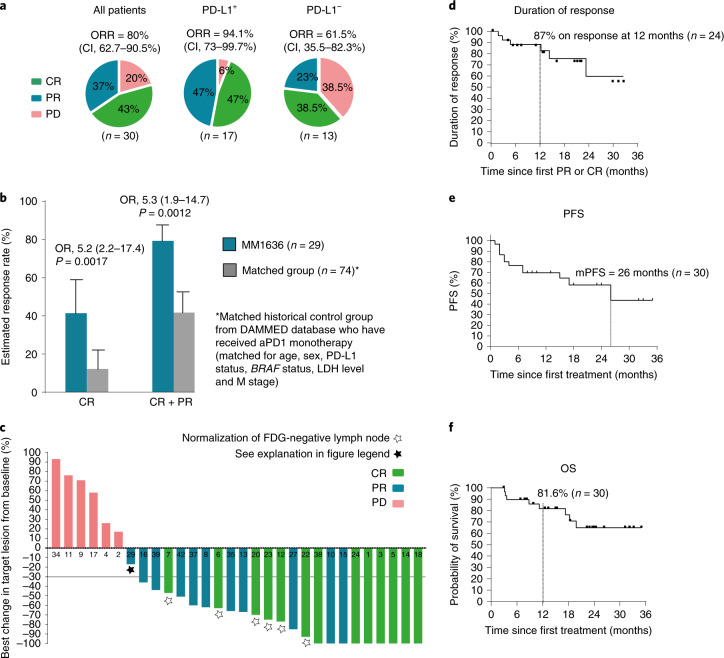
Fig. 1. Clinical response.
a, Pie charts with percent ORR, CR, PR and PD according to RECIST 1.1 by investigator review of all patients (n = 30), PD-L1+ patients (>1%, (n = 17)) and PD-L1− patients (<1%, n = 13)), respectively. Two-sided CIs (95%) were constructed using the Clopper–Pearson method. b, Treatment effect in MM1636 compared with a matched historical control group from the DAMMED database (n = 74). Patients in MM1636 (n = 29) were matched with the exact same combination variable according to age (≤70 years, >70 years), sex, LDH levels (normal, elevated), M stage (M1a, M1b, M1c), BRAF status (wild type, mutated) and PD-L1 status (<1%, ≥1%). Estimates for treatment effects were calculated by weighted logistic regression analyses and weighted Cox proportional hazard model. Bar height indicates the estimated response rate; tops of bars are centers for error bars. Odds ratios (OR), response rates and their corresponding 95% CIs were extracted from the regression model. All P values were two sided, and P values below 0.05 were considered statistically significant. c, Best change in the sum of target lesion size compared with that at baseline (n = 30). The horizontal line at −30 shows the threshold for defining an objective response in the absence of non-target disease progression or new lesions according to RECIST 1.1. Two patients with 100% reduction in target lesion size had non-target lesions present. White stars, six patients had normalization (<10 mm) of fluor-18-deoxyglucose (FDG)-negative lymph nodes (at baseline, lymph nodes were >1.5 cm and FDG+) and 100% reduction of non-lymph node lesions and are considered to have had a CR (green bar). Black star, one patient (MM29) was considered to have had a PR (blue bar), although he had not reached a −30% change in target lesion size. The patient had a single measurable 13-mm lung metastasis at baseline and multiple biopsy-verified cutaneous metastases on the left crus (not detectable by positron-emission tomography–computed tomography (PET–CT) at baseline). The best change in target lesion size was 10 mm, and a post-treatment biopsy from the cutaneous metastases showed no sign of malignancy. Thus, overall, the patient was classified as having a PR. d, Kaplan–Meier curve of the response duration in the 24 patients with an objective response. e, Kaplan–Meier curve of PFS in all 30 treated patients. f, Kaplan–Meier curve of OS in all 30 treated patients.

