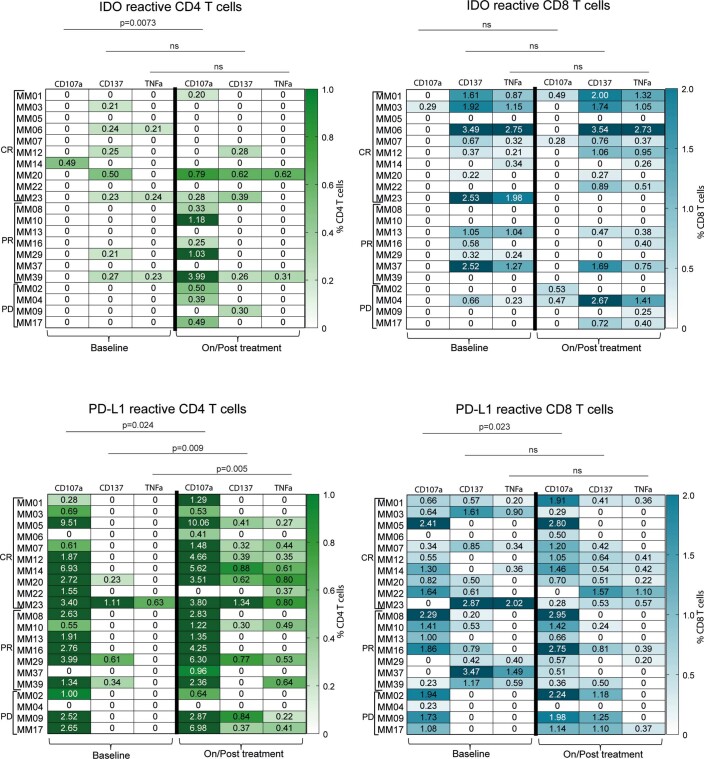
Extended Data Fig. 5. CD4 and CD8 vaccine specific T cell responses in blood.
Top: heatmaps of IDO specific CD4 (left) and CD8 (right) T cell responses in PBMCs at baseline and on/post treatment. Bottom: heatmaps of PD-L1 specific CD4 (left) and CD8 (right) T cell responses. Responses quantified by flow cytometry by an increased expression of CD107α, CD137 and TNFα after 8h peptide stimulation. Values represent specific responses after background values have been subtracted (n=21). Statistical analysis were performed using two-sided Wilcoxon matched-paired rank test.

