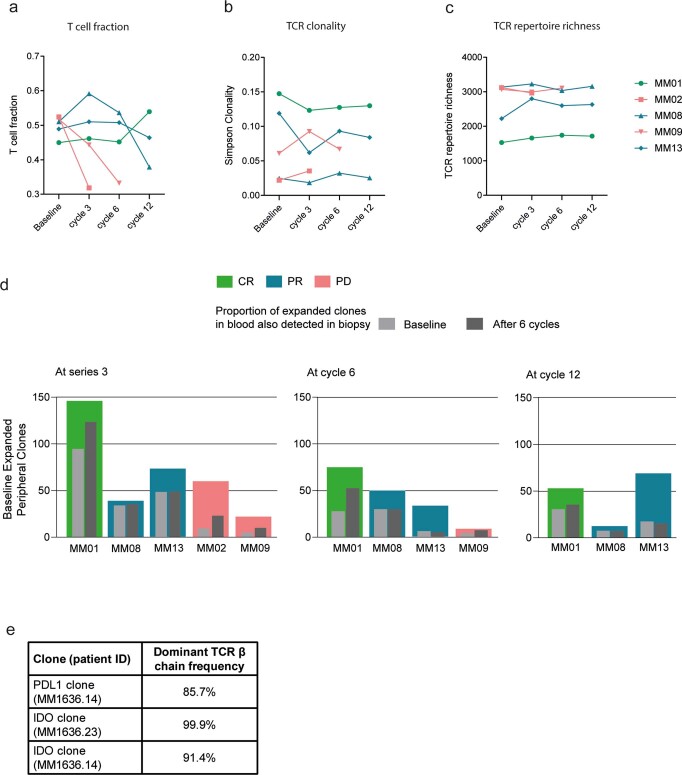
Extended Data Fig. 8. T cell changes in blood after treatment. T cell fraction, TCR clonality and repertoire richness in blood and peripherally expanded TCR clones in both responding and non-responding patients.
a) T cell fraction in peripheral blood of five patients at baseline, series 3, 6 and 12 by TCR sequencing. T cell fraction was calculated by taking the total number of T cell templates and dividing by the total number of nucleated cells (n=5.) b) TCR clonality in peripheral blood of five patients at baseline, series 3, 6 and 12 by TCR sequencing (n=5). Simpson clonality measures how evenly TCR sequences are distributed amongst a set of T cells where 0 indicate even distribution of frequencies and 1 indicate an asymmetric distribution where a few clones dominate. c) TCR repertoire richness in peripheral blood of five patients at baseline, series 3, 6 and 12 by TCR sequencing (n=5). TCR repertoire richness report the mean number of unique rearrangements. d) Bar-chart chart representing dynamics of the expanded T cell clones. Coloured bars represent peripherally expanded clones in five patients at series 3, series 6 and series 12 as compared to the baseline PBMC samples (n=5). Light gray bar represents peripherally expanded clones that are present in baseline biopsy samples while dark gray bar represents peripherally expanded clones that are present in the post-treatment biopsy (after 6 series). e) Frequency of the dominant TCR β chain in clonal PD-L1 and IDO specific cultures as determined by CDR3 sequencing.

