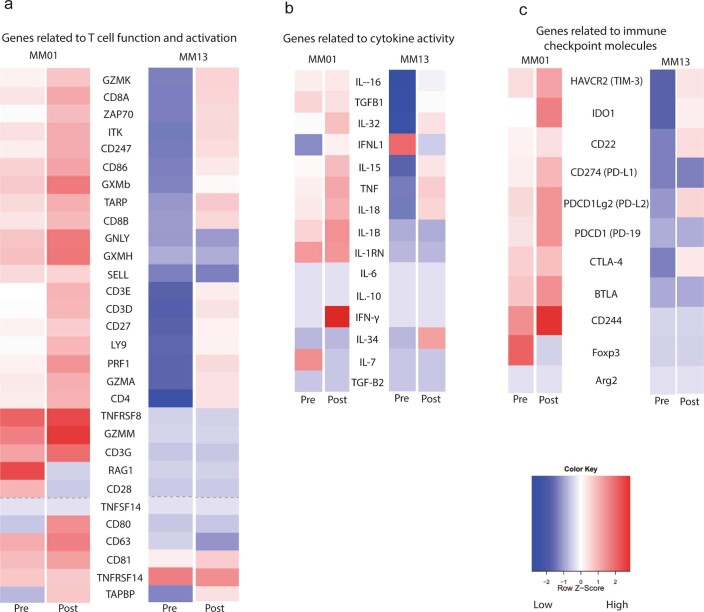
Extended Data Fig. 9. Profiling of genes relevant to T cell activation, cytokines and exhaustion markers on pre- and post-treatment biopsies in two patients.
a) RNA expression profiling of genes related to T cell activation was performed using NanoString nCounter (n=2). b) RNA expression profiling of genes related to cytokine activity was performed using NanoString nCounter (n=2). c) RNA expression profiling of genes related to checkpoint inhibitors was performed using NanoString nCounter (n=2).

