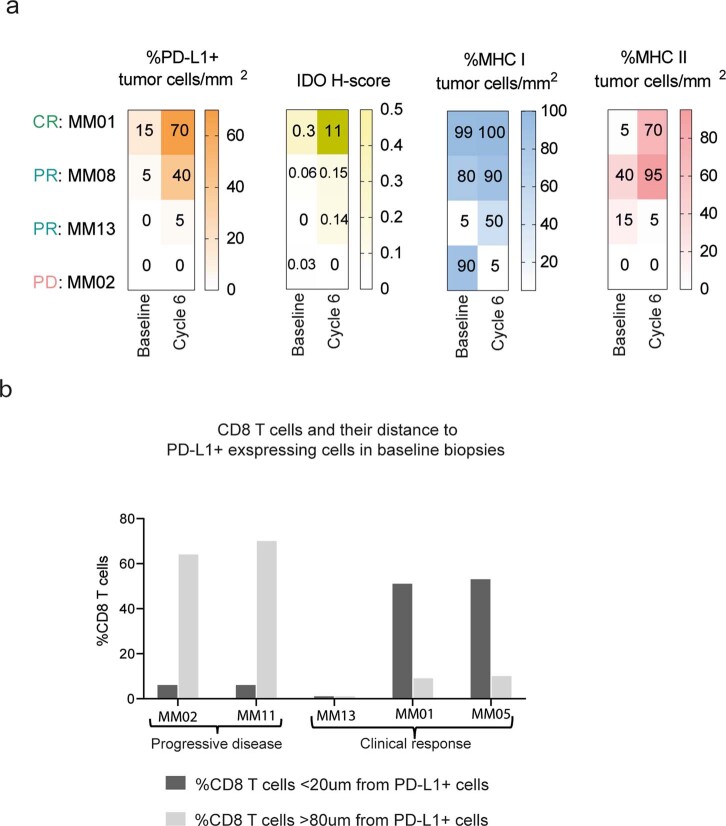
Extended Data Fig. 10. Treatment induced upregulation of PD-L1, IDO, MHC I and MHC II and distance between CD8 T cells and PD-L1 expressing cells.
a) IHC on 4 paired biopsies stained for CD3 and CD8 T cells, PD-L1, MHC I and MHC II on tumor cells/mm2 (sum in the validated area) and IDO H-score (from 0 to 300). H-score is the expression of IDO on both immune and tumor cells: The score is obtained by the formula: 3 x percentage of cells with a strong staining + 2 x percentage of cells with a moderate staining + percentage of cells with a weak staining (n=4). b) Distance in µm between CD8+ T cells and PD-L1+ stained cells on five baseline biopsies detected by IHC (n=5).

