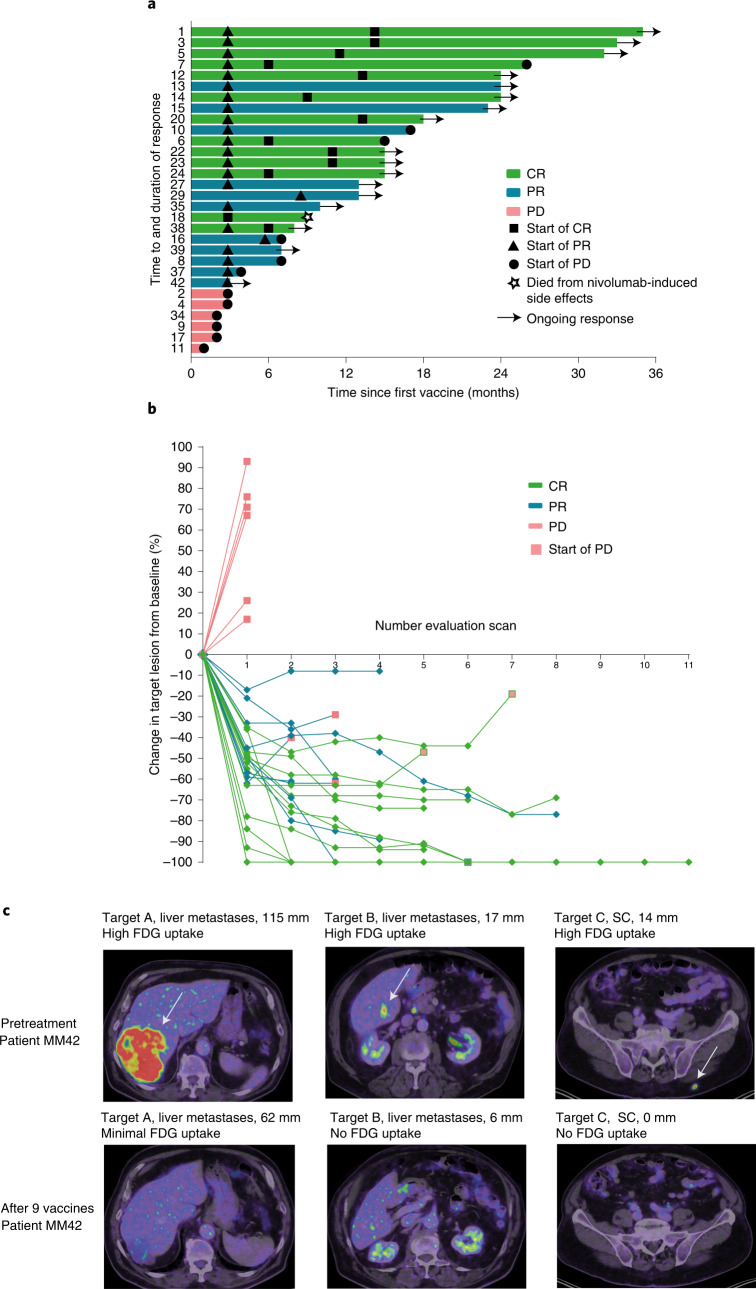
Fig. 2. Clinical response.
a, Swimmer plot showing response duration and time to response according to RECIST 1.1 for all treated patients (n = 30). Triangles indicate first evidence of PR, while squares indicate first evidence of CR. Closed circles indicate time of progression. Arrows indicate ongoing responses. Patient MM18 died due to nivolumab-induced side effects. b, Spider plot showing response kinetics in all treated patients (n = 30). Red squares indicate time of progression. c, PET–CT images of patient MM42 before and after treatment (after 12 series of treatment) showing FDG metabolism in target lesions. SC, subcutaneous.

