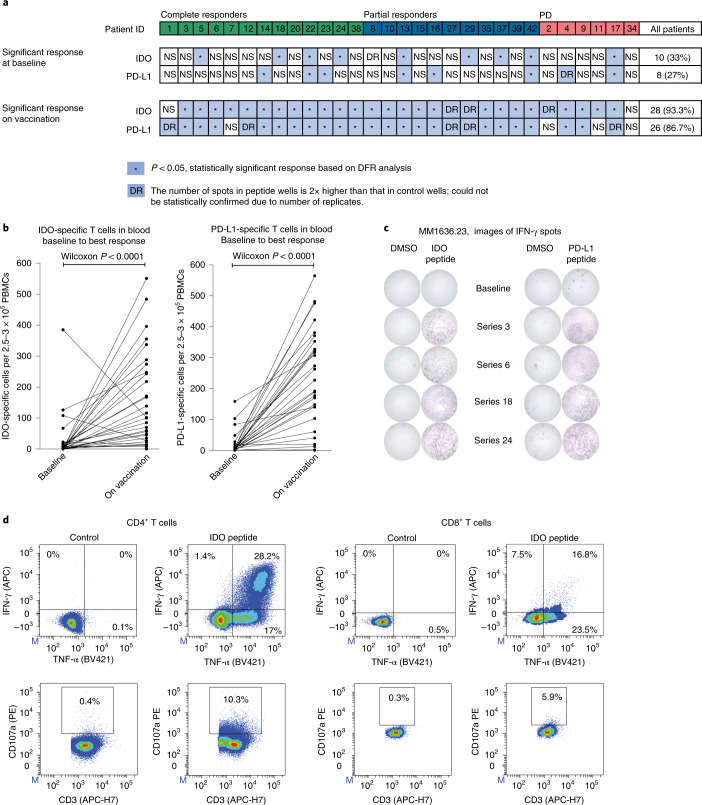
Fig. 3. Vaccine-specific responses in blood.
a, IDO- and PD-L1-specific T cell responses in PBMCs at baseline and on vaccination as measured by the IFN-γ ELISPOT assay (n = 30). *Responses were calculated as the difference between the average numbers of spots in wells stimulated with IDO or PD-L1 peptide (triplicates) and those from the corresponding control (DMSO), and statistical analyses of ELISPOT responses were performed using a distribution-free resampling method (Moodie et al.50). DR (double response), response was not statistically confirmed due to replicate number, but the number of spots in peptide wells was two times higher than that in control wells (DMSO). NS, no significant response and no DR. For a detailed overview of responses at serial time points on vaccination, see Extended Data Fig. 4a. b, IDO- and PD-L1-specific T cell response in PBMCs in all treated patients measured by the IFN-γ ELISPOT assay at baseline and on vaccination. On-vaccination responses were selected from the ‘best’ ELISPOT response at different time points for each patient (series 3, 6, 12, 18 or 24) during vaccination (n = 30). Wilcoxon matched-pairs signed-rank test was used to compare responses to IDO or PD-L1 peptides in the vaccine between baseline and later time points. c, Representative example of ELISPOT wells with response in patient MM23 in serial PBMCs before and on treatment. d, IDO-specific CD4+ and CD8+ T cells were isolated and expanded from PBMCs stimulated in vitro with the IDO peptide and a low dose of IL-2 for 14–15 d before sorting using the Miltenyi Cytokine Secretion Assay—Cell Enrichment and Detection kit. To assess their cytolytic potential, IDO-specific T cells were stimulated with IDO peptide, and expression of CD107a, IFN-γ and TNF-α was assessed by flow cytometry (the example is from patient MM14).

