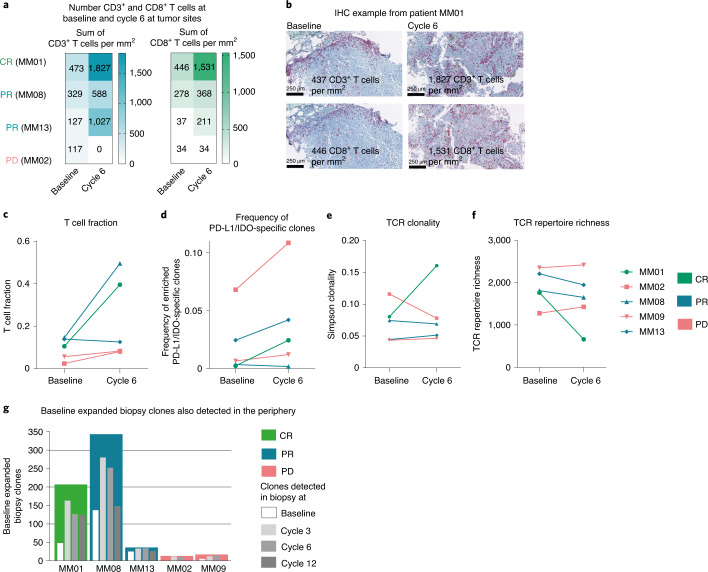
Fig. 5. Changes in the TME after treatment. Number of CD3+ and CD8+ T cells, TCR fraction, TCR clonality, TCR repertoire, biopsy expanded TCR clones and enrichment of IDO- and PD-L1-specific T cells at the tumor site.
a, Number of CD3+ and CD8+ T cells per mm2 (sum in the validated area) at the tumor site detected by IHC of paired biopsies from four patients. b, Example of IHC of CD3+ and CD8+ T cells at the tumor site before and after treatment (cells per mm2) in one patient (MM01). c, T cell fraction at the tumor site at baseline and cycle 6 by TCR sequencing. The T cell fraction was calculated by taking the total number of T cell templates and dividing by the total number of nucleated cells. d, Tracking of vaccine-associated clones at baseline and cycle 6 in tumor biopsies. Cumulative frequencies of IDO and PD-L1 vaccine-specific TCR rearrangements are represented. e,f, TCR clonality and TCR repertoire richness in five patients at the tumor site at baseline and cycle 6. Simpson clonality measures how evenly TCR sequences are distributed among a set of T cells, where 0 indicates an even distribution of frequencies and 1 indicates an asymmetric distribution in which a few clones dominate. TCR repertoire richness reports the mean number of unique rearrangements. g, Bar chart representing baseline expanded biopsy clones from five patients (colored bars) and the detection of biopsy expanded clones also found in the blood at baseline and series 3, 6 and 12 (white and gray bars) by TCR sequencing.

