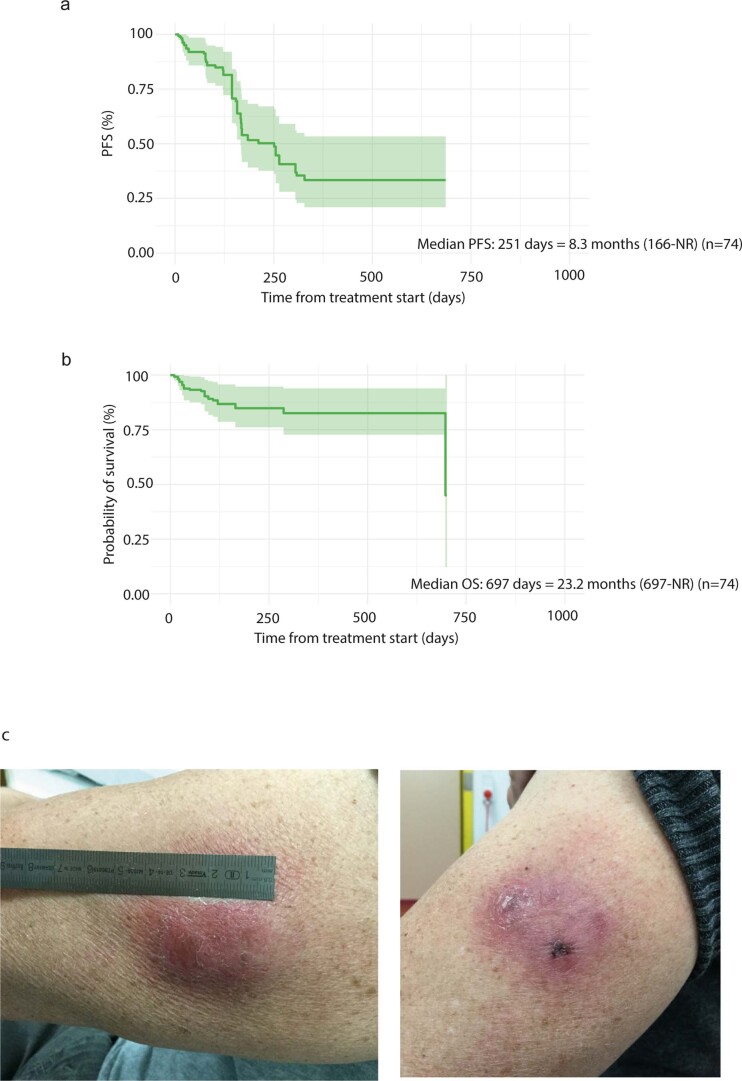
Extended Data Fig. 2. Progression free survival and overall survival in matched historical control group and vaccine injection site reaction.
a) Kaplan-Meier curve of progression free survival with corresponding 95% confidence intervals in the matched historical control group (n=74). Patients were matched on BRAF-status, PD-L1-status, age, gender, M-stage and LDH level). b) Kaplan-Meier curve of overall survival with corresponding 95% confidence intervals in the matched historical control group (n=74). c) Images of injection site reaction in patient MM20 (CR) after 11 vaccination show redness, rash and granuloma at injection site.

