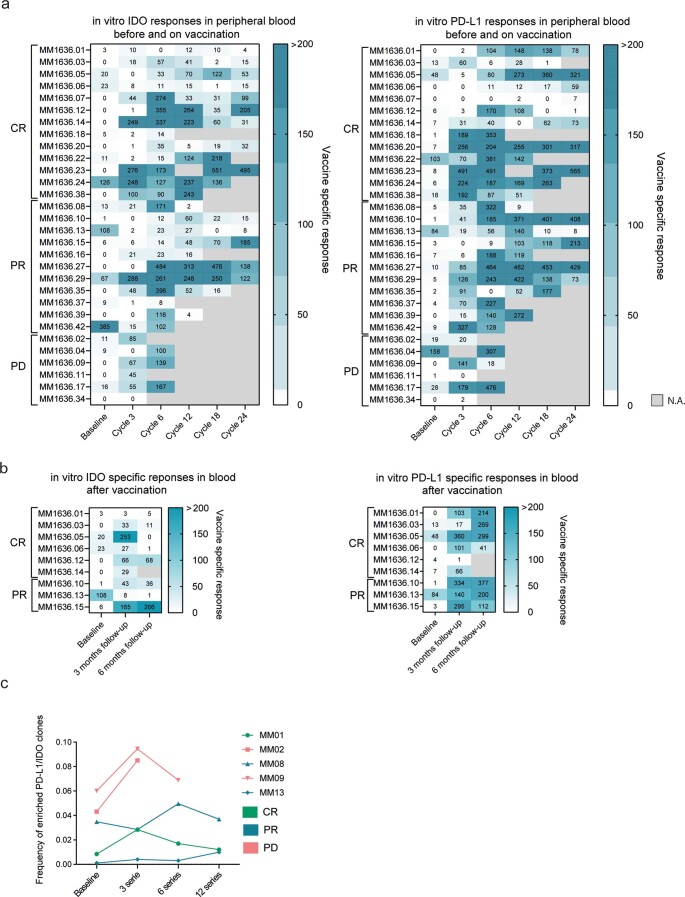
Extended Data Fig. 3. Vaccine specific responses in blood.
a) Heatmap of specific (background has been subtracted) IDO and PD-L1 responses in PBMCs at baseline, series 3, 6, 12, 18 and 24 measured by in vitro IFN-γ Elispot assay show fluctuations in the blood during treatment (n=30). b) Heatmap of specific (background has been subtracted) IDO and PD-L1 responses in PBMCs at baseline and 3 and 6 months after last vaccine measured by in vitro IFN- γ Elispot assay (n=30). 2.5–3.2x10⁵ cells per well were used. c) Vaccine associated clones were tracked in the blood by summing the frequency of each rearrangement enriched in either IDO or PD-L1 T cells.

