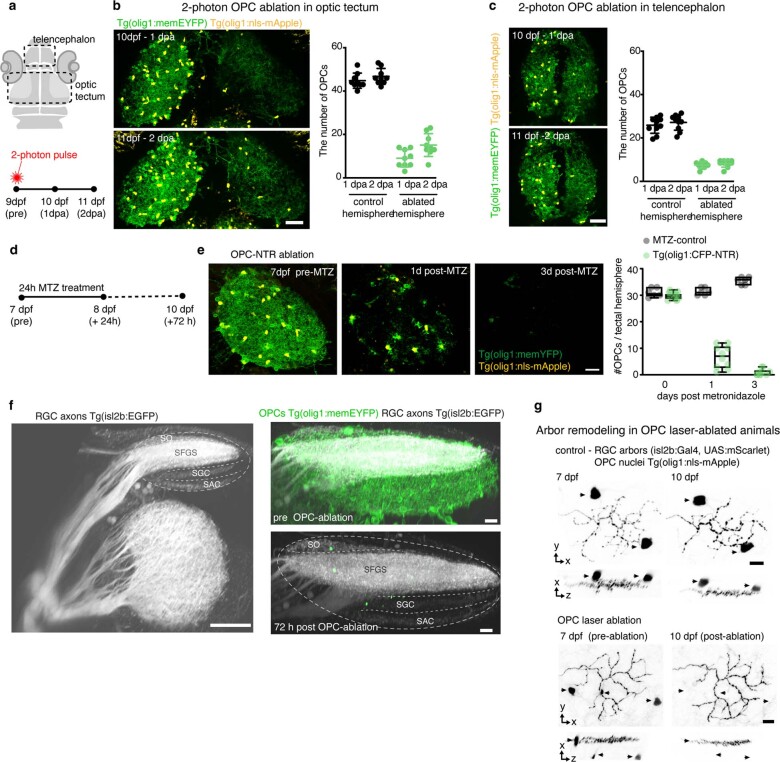
Extended Data Fig. 4. Characterization of late OPC ablation methods.
a) Top: drawing of zebrafish head delineating the position of the optic tectum and telencephalon as shown in panels (b) and (c). Bottom: Schematic of OPC laser ablation paradigm. b) Dorsal views of OPC reporter lines showing the optical tectum after unilateral OPC ablation using 2 photon laser pulses and quantification of OPC numbers per tectal hemisphere. Data are expressed as mean ± S.D. (44.8 ± 3.5 in control vs. 9.0 ± 4.0 in ablated animals at 1 dpa; 46.8 ± 3.7 in control vs. 15.1 ± 5.2 in ablated animals at 2 dpa; n=9 animals per group from three experiments). Scale bar: 50 µm. c) Dorsal views of OPC reporter lines showing the telencephalon after unilateral OPC ablation using 2 photon laser pulses and quantification of OPC numbers per tectal hemisphere. Data are presented as mean ± S.D. (25.4 ± 3.7 in control vs. 7.1 ± 1.4 in ablated animals at 1 dpa; 26.7 ± 3.6 in control vs. 7.7 ± 1.6 in ablated animals at 2 dpa; n=10 animals per group from four experiments). Scale bar: 50 µm. d) Schematic of OPC NTR ablation paradigm in panels e and f. e) Example images with OPC NTR ablation and quantification of OPC numbers at different time points after MTZ treatment of Tg(olig1:CFP-NTR) animals. Boxes represent the median (center line) and I.Q.R. (32±30/33 cells in control vs. 30±29/36 cells in NTR animals before MTZ treatment; 32±30/34 cells in control vs. 8±4/10 cells in NTR animals at 1 day after MTZ treatment; 34±32/36 cells in control vs. 1±0/3 cells in NTR animals at 3 days after MTZ treatment), and whiskers indicate the minimum and maximum values. n=8/14 animals in MTZ-control/OPC NTR ablation from three experiments. f) Left: 3D rotation view of RGC axon projections showing major projection layers in the tectal neuropil: stratum opticum (SO), stratum fibrosum et griseum superficiale (SFGS), stratum griseum centrale (SGC), stratum album centrale (SAC). Representative images from 12 animals in five independent experiments. Scale bar: 50 µm. Right: Overall layering of RGC projections remains intact after OPC ablation. Representative images from 7 animals in three experiments. Scale bar: 10 µm. g) Confocal images of individual RGC axon arbors at 7 and 10 dpf in control and OPC ablated animals (n numbers as in Fig. 3c). Arrowheads depict OPCs. Scale bars: 10µm. See Fig. 3c for traces.

