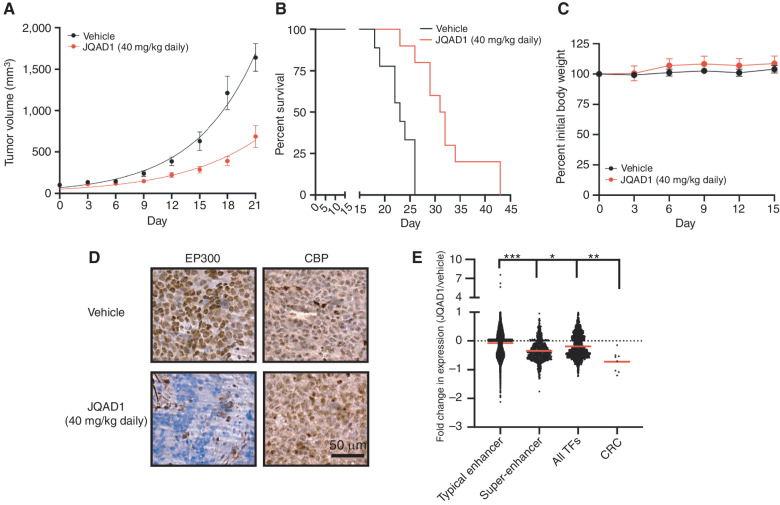
Figure 6.
JQAD1 causes tumor growth suppression and loss of EP300 in vivo. A, Kelly NB cell xenografts were established in NSG mice and mice treated with vehicle control (n = 9) or JQAD1 at 40 mg/kg i.p. daily (n = 10). Tumor growth curve kinetics were also analyzed by two-way ANOVA with mixed-effects analysis, demonstrating that JQAD1 suppresses tumor growth (P < 0.0001 for vehicle vs. JQAD1 treatment groups). B, Kaplan–Meier survival analysis of mice in A. JQAD1 prolongs survival (log-rank test P = 0.0003 for JQAD1-treated mice compared with vehicle). C, Normalized body weights of animals from A and B. D, IHC of EP300 and CBP in Kelly cell xenografts treated with either vehicle control or JQAD1 (40 mg/kg i.p. daily) for 14 days. Data are representative of three independent animals per treatment. Scale bar, 50 μm. E, ERCC spike-in RNA-seq was performed on tumor cells recovered from animals treated in D. Results are shown as the fold change in expression of animals treated with 40 mg/kg JQAD1 daily (n = 3) compared with vehicle control (n = 4) at day 14. RNA-seq groups of genes are stratified by their regulation by typical or super-enhancers and gene identity of TF or CRC gene. ***, P < 0.0001 between typical enhancer and super-enhancer groups and between typical enhancer and CRC gene expression; *, P = 0.0223 between super-enhancer groups and CRC gene expression; **, P = 0.0013 between all TFs and CRC gene expression. See also Supplementary Fig. S5.

