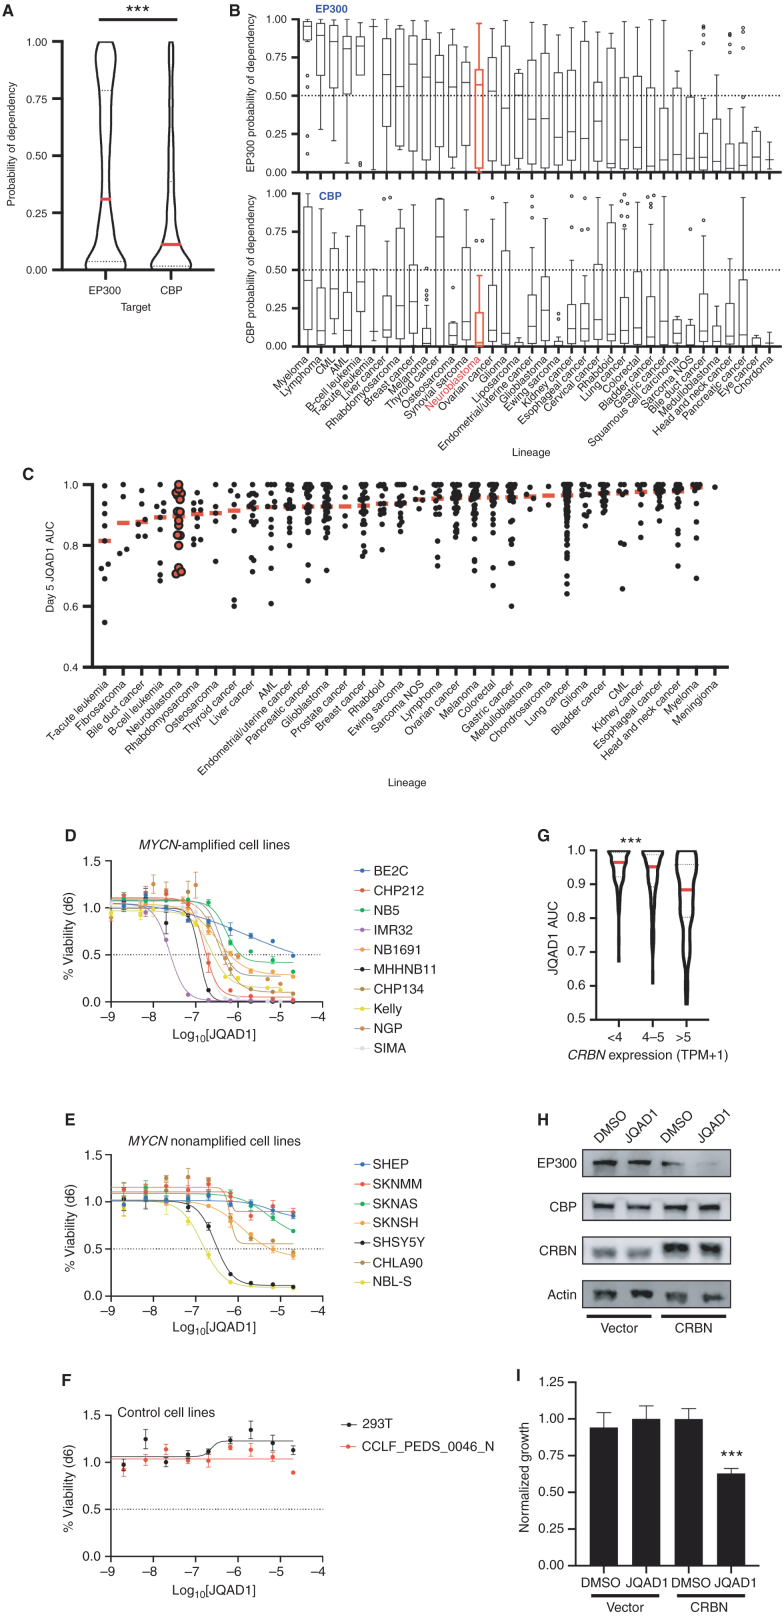
Figure 7.
Cancer cells display increased dependency on EP300 compared with CBP. A, Probability of dependency of all cell lines in DepMap (n = 757, 20Q2 release), on EP300 and CBP were compared, demonstrating dependency on EP300 in 308 of 757 (40.7%) and CBP in 140 of 757 (18.5%) of all cell lines, determined by probability of dependency >0.5. ***, P < 0.0001 by two-tailed Student t test. AML, acute myeloid leukemia; CML, chronic myeloid leukemia; NOS, not otherwise specified. B, Individual lineages of cell lines from A were identified, and average probability of dependency on EP300 and CBP were plotted. Red, NB; black, other tumor lineages; bar in box, median; whiskers, 10th–90th centiles; dots, outliers. C, Barcoded cancer cell lines (n = 557) were treated with a concentration range of (R,S)-JQAD1 of 1.2 nmol/L to 20 μmol/L for 5 days prior to sequencing of barcodes. Cell lines were individually classified by lineages, and AUC of the dose–response relationship was plotted. Red bars, median; individual black dots, individual cell lines; red dots, NB cell lines. AUC was calculated from triplicate measurements at each dose at time = 120 hours. D–F, NB and control cell lines were grown for 6 days in the presence of JQAD1 in a dose range from 4.3 nmol/L to 20 μmol/L prior to CellTiter-Glo analysis. Dose–response curves are based on three independent replicates per cell line at each dose. Bars, SEM. Analysis was performed on MYCN-amplified (D), nonamplified (E), and control (F) cell lines, including 293T cells and primary human fibroblasts (CCLF_PEDS_0046_N). All cell lines are of the adrenergic subtype except for NB5 and SKNMM (unknown), and CHP212, SHEP, and SKNAS (mesenchymal). Adrenergic or mesenchymal cell state annotations are derived from refs. 33 and 69. G, JQAD1 AUC values from C were plotted against CRBN expression from the CCLE. ***, P < 0.001 by ANOVA for >5 transcripts per million (TPM) compared against <4 and 4 to 5 TPM groups with post hoc Bonferroni correction. H, BE2C cells stably expressing control (zsGreen) or CRBN (CRBN) were established, and pools of cells were treated with DMSO or 10 μmol/L JQAD1 for 24 hours. Cell lysates were subjected to Western blotting for EP300, CBP, and CRBN. Actin is shown as a loading control. Data are representative of three independent treatments and analyses. I, BE2C cells stably expressing control (zsGreen) or CRBN (CRBN) were treated with DMSO or 10 μmol/L JQAD1 for 6 days prior to CellTiter-Glo analysis for cell growth. Data were normalized against BE2C-zsGreen, DMSO-treated cells. ***, P = 0.008 by Student t test comparing BE2C-CRBN DMSO- and JQAD1-treated cells. n = 3 biological replicates. See Supplementary Fig. S6.

