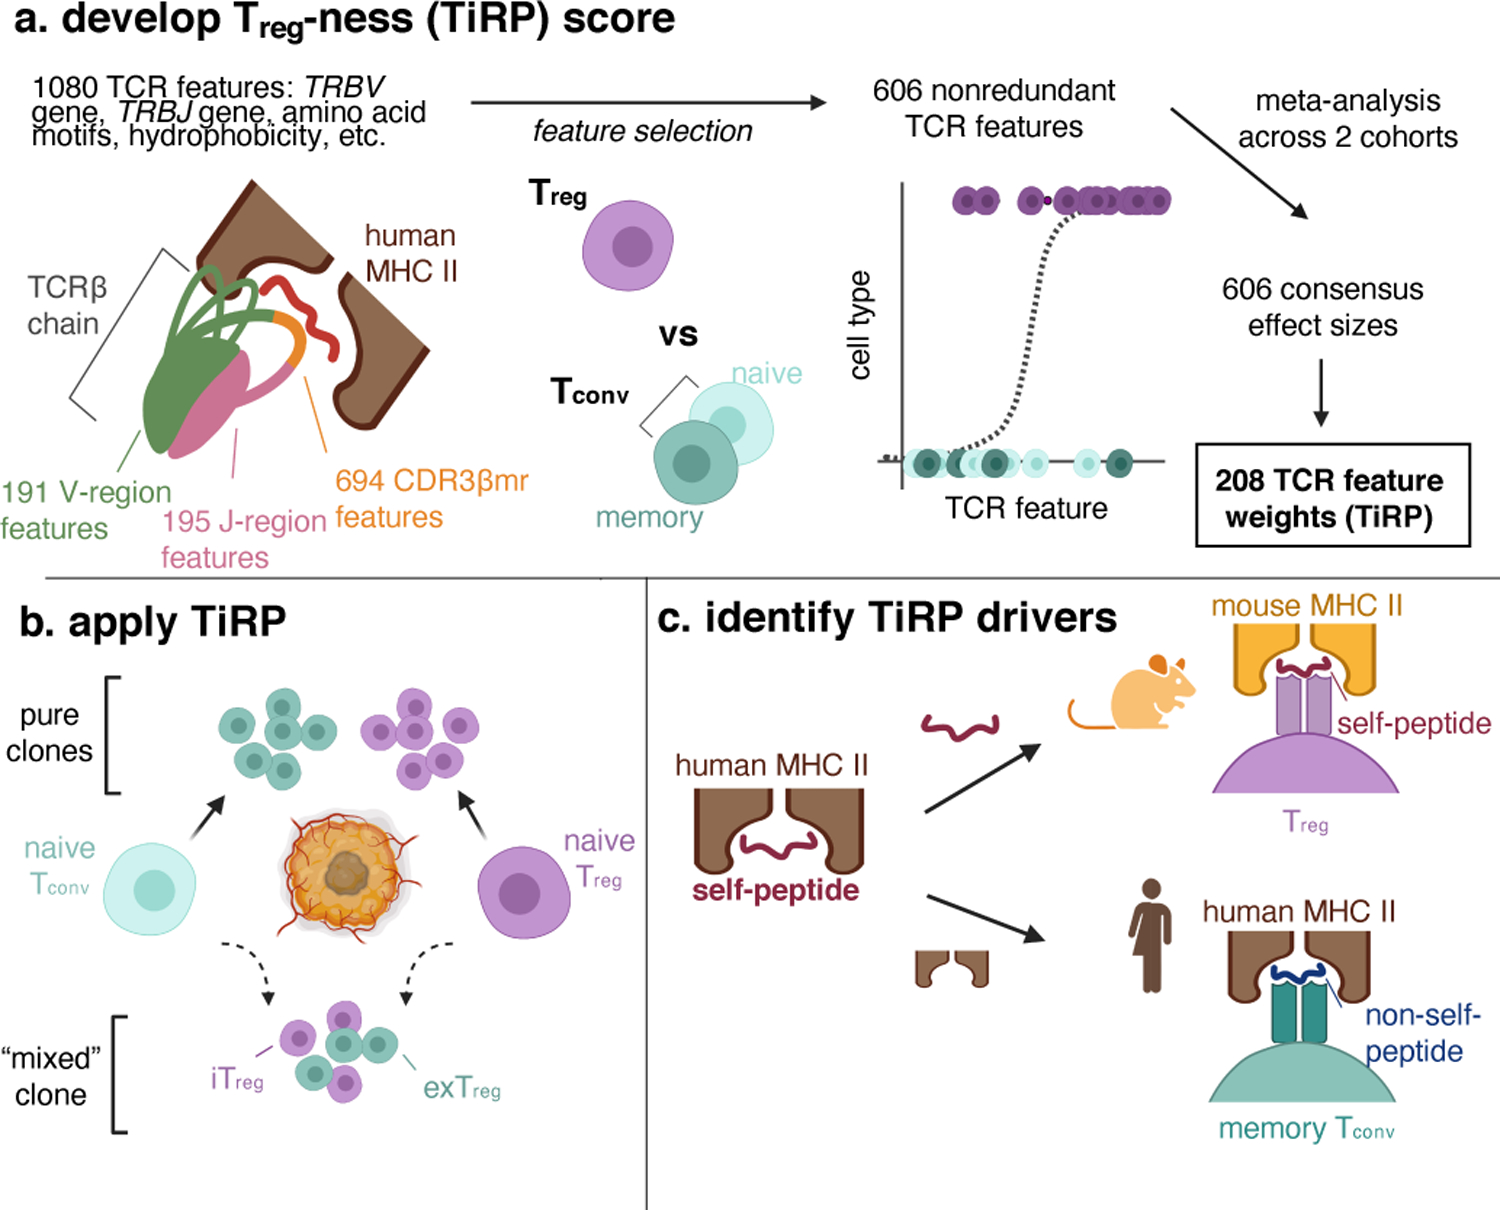
Figure 1. Study design.

(a) We first examined the structure of the T cell receptor (TCR) sequence to define 1080 sequence features. Depicted is a T cell receptor (TCR) β chain in complex with antigenic peptide (red) and human MHC II molecules (brown). The TCR is colored by region: V-region (including CDR1β and CDR2β loops) in green, CDR3β middle region (CDR3βmr) in orange, and J-region in pink. We used mutual information analysis and mixed effects model comparisons to select 606 nonredundant TCR features that best explained variance in T cell state. We fit mixed effects logistic regression models for 70% of the data in the discovery and replication cohorts separately, and combined the effect sizes for each TCR feature across the two cohorts by meta-analysis. TiRP was calibrated to include only 208 of the 606 TCR features that had Bonferroni-significant meta-analytic P values. (b) We then applied TiRP to the TCRs to tumor-infiltrating CD4+ cells in order to study mixed clones: groups of Tregs and Tconvs with the same TRB and TRA sequences observed in the same individual. These mixed clones likely represent lineages of T cells that have undergone a peripheral conversion between the regulatory and conventional phenotypes. Such clones may include induced or iTregs (Tconv cells that have acquired a regulatory phenotype), exTregs (Treg cells that have lost the regulatory phenotype), or both. (c) Finally, we investigated the drivers of TiRP by separately examining the two elements of the human Treg TCR ligand: the self-peptide and the human MHC II molecule.
Figure created with BioRender.com.
