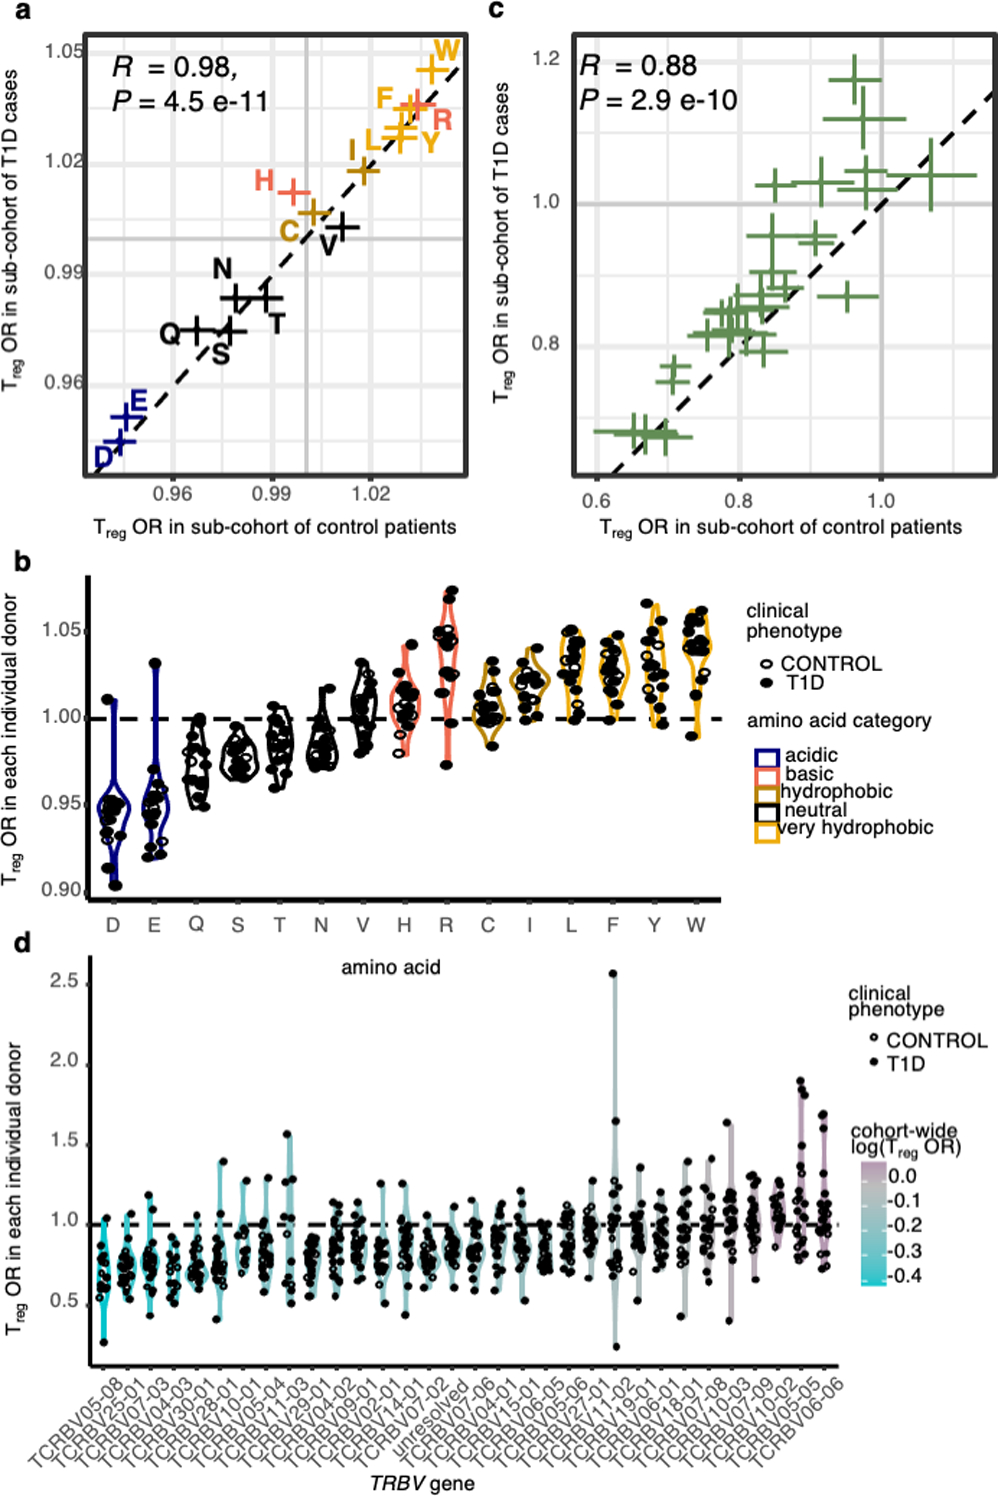
Extended Data Fig. 2: Consistency of TCR feature effects across individuals and clinical phenotypes.

(a) Treg odds ratio per standard deviation increase in CDR3βmr occupancy by each of the 14 relevant amino acids, estimated separately for the T1D cases in the discovery cohort (y axis) and the controls (x axis) (b) Treg odds ratio per standard deviation increase in CDR3βmr occupancy by each of the 15 relevant amino acids, estimated separately in each donor. (c) Treg odds ratio for the usage of each TRBV gene relative to the reference gene TRBV05–01, estimated separately for the T1D cases in the discovery cohort (y axis) and the controls (x axis) (d) Treg odds ratio for the usage of each TRBV gene relative to the reference gene TRBV05–01, estimated separately in each donor. P values in (a) and (c) are calculated by a two-sided t-test with Fischer transformation on Pearson’s R.
