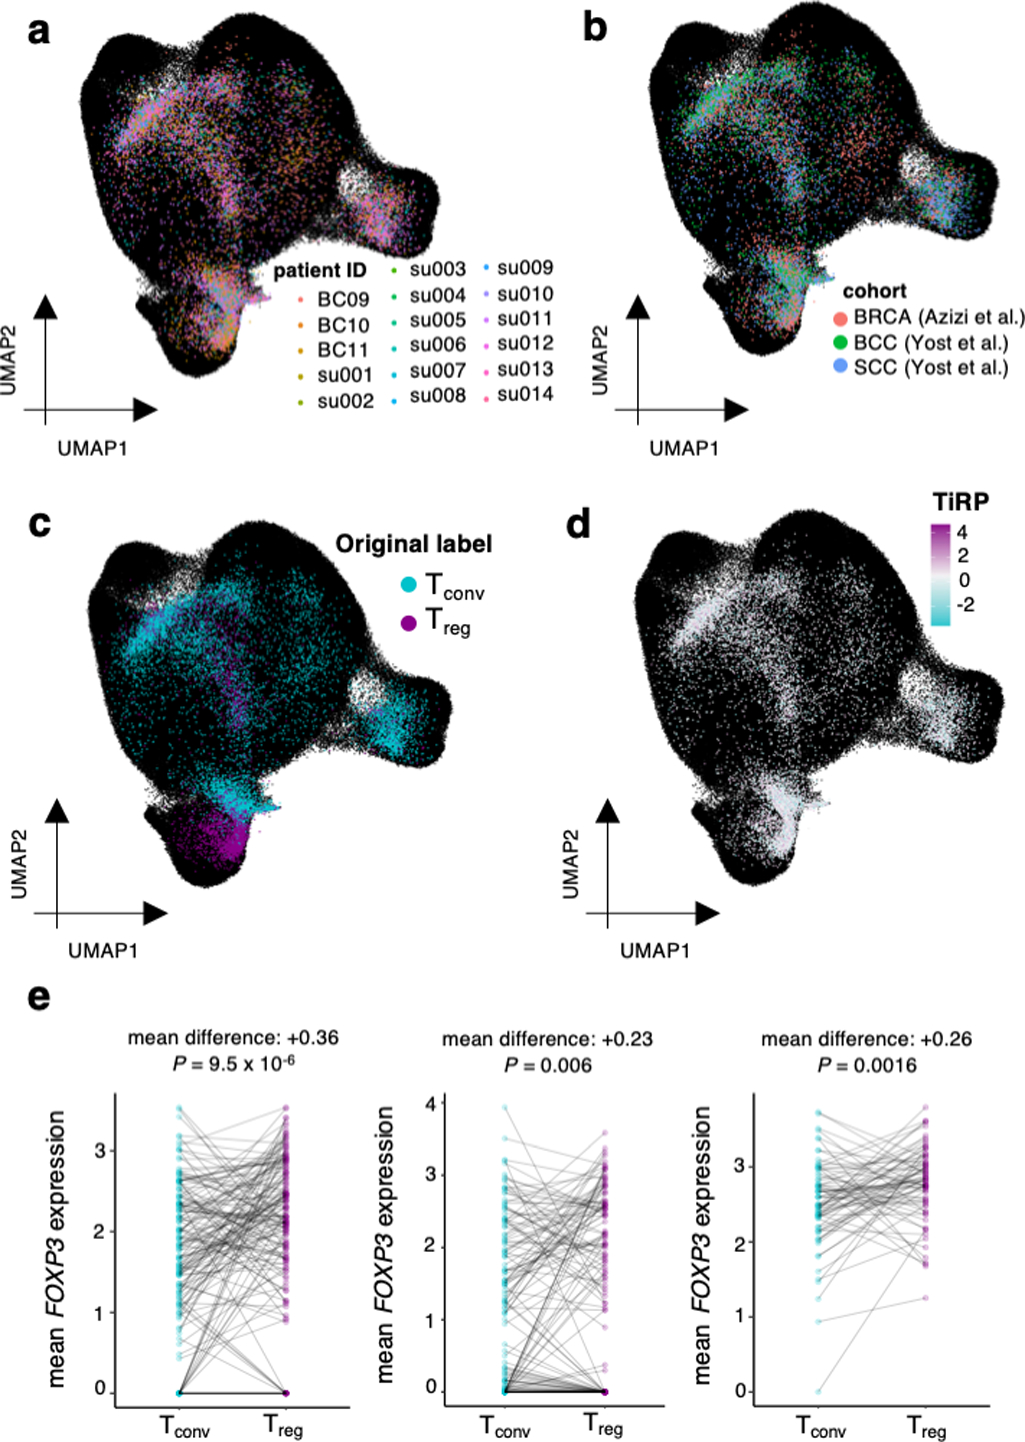
Extended Data Fig. 8: Symphony mapping details.

(a) Tumor microenvironment T cells mapped into the reference embedding by Symphony, colored by donor to reveal successful integration of donors. (b) same as (a), colored by cancer type to reveal successful integration of cohorts. (c) Tumor microenvironment T cells mapped into the reference embedding by Symphony, colored by cell types derived from internal clustering (by Yost et al. for the SCC and BCC samples, and as depicted in Extended Data Figure 7a−b for the BRCA samples) to show the extent of concordance with Symphony’s cell type solutions. (d) same as (a), colored by the TiRP score of their TCR. TiRP is scaled such that 0 corresponds to the mean score and one unit corresponds to one standard deviation of held-out bulk sequencing TCRs (Figure 5c). (e) FOXP3 expression differences between Tregs and Tconvs within mixed clones of three representative donor samples. Each mixed clone is represented by a line connecting the average FOXP3 expression of Tregs within the clone to the average FOXP3 expression of Tconvs within the clone. Each P value is computed by a two-sided paired t-test comparing the mean FOXP3 expression in Tregs to that in Tconvs within each mixed clone.
