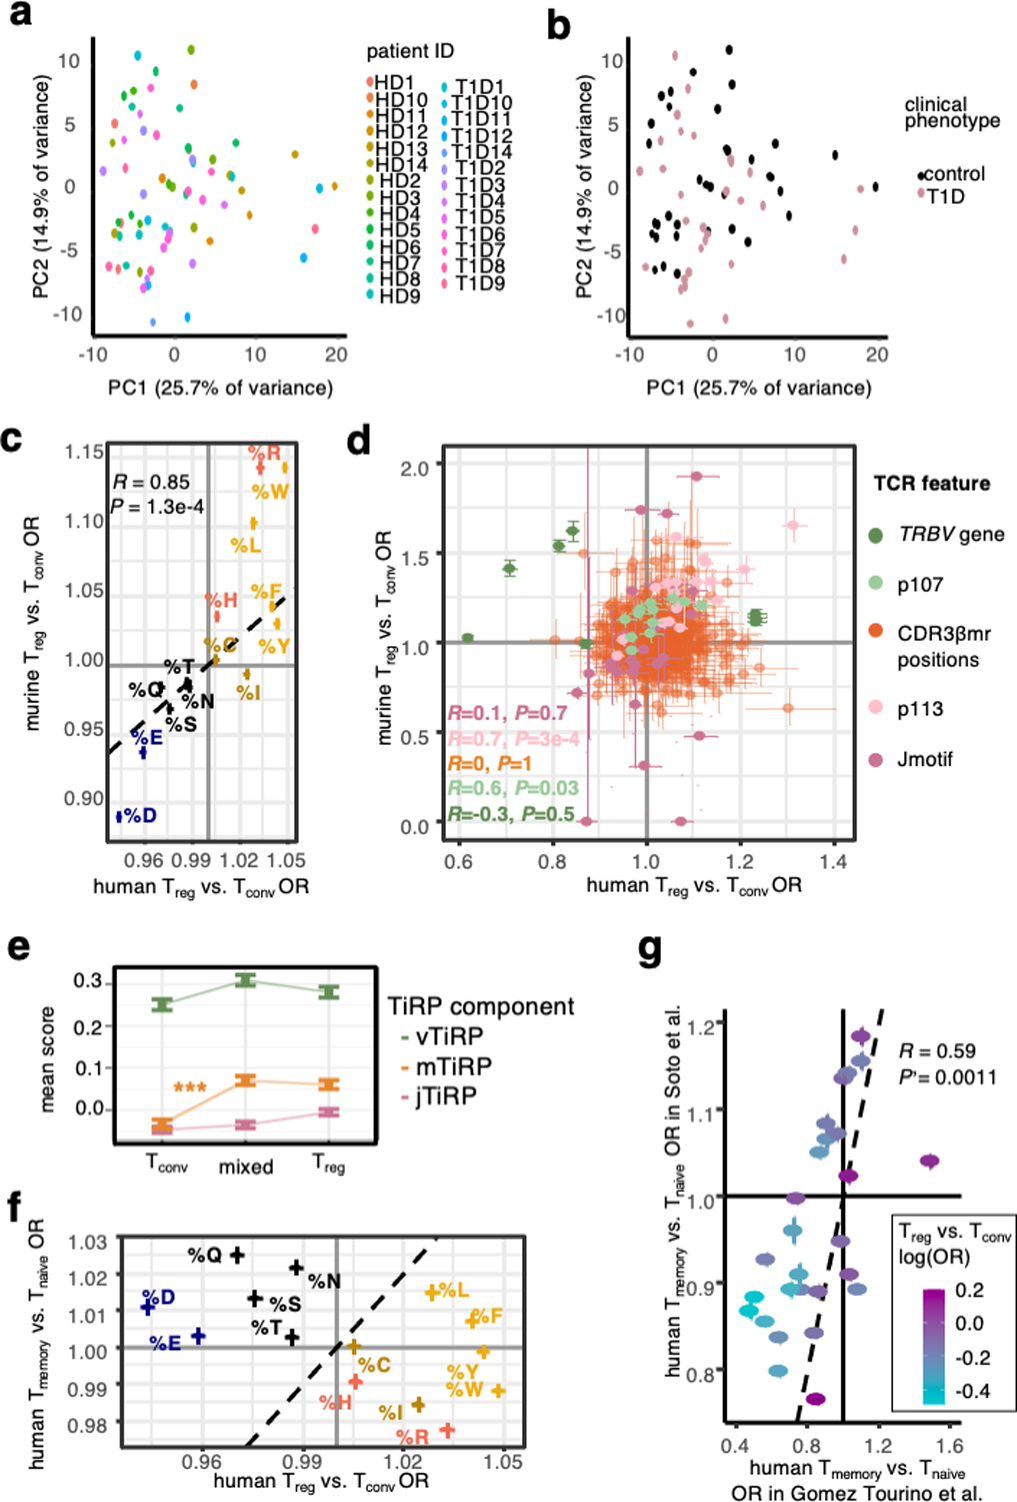
Extended Data Fig. 9: Further analysis of principal components, murine Tregs, and human memory Tconv.

(a) 67 samples from the replication cohort colored by donor ID and arranged by principal component space according to variation in TCR sequence feature frequencies. (b) Same as (a), colored by donor clinical phenotype. (c) Replication of CDR3βmr percent composition of amino acid effects in mice. Error bars correspond to 95% confidence intervals for ORs. (d) Lack of mouse-human correspondence for position-specific TCR feature effects. TCR features are colored by type; error bars denote OR 95% confidence intervals. Murine TRBV genes were mapped to their human homologs for comparison, only those with a human homolog are shown (Methods). (e) Mean TiRP component scores for CD4+ expanded pure Tconv, pure Treg, and mixed clones in the tumor microenvironment15,16. Error bars denote standard error of the mean. Tconv mTiRP compared to mixed clone mTiRP two-sided Wald test P = 2.9 × 10⁻⁴, all other comparisons nonsignificant. (f) Overall lack of correspondence between Treg-Tconv OR and memory-naïve OR for CDR3βmr percent composition of amino acids. Error bars correspond to 95% confidence intervals, and amino acids are colored by the scheme in (c). (g) Replication of memory Tconv – naive Tconv TRBV gene odds ratios in an independent dataset of sorted memory and naïve T cells from 4 healthy donors31. TRBV genes are colored by their Treg-Tconv odds ratios. For (c), (d), (f), and (h), R = Pearson’s correlation coefficient and P values are computed by a two-sided t-test with Fischer transformation. For (e)-(g), human Treg-Tconv OR result from fixed-effect meta-analysis across the discovery and replication cohorts.
