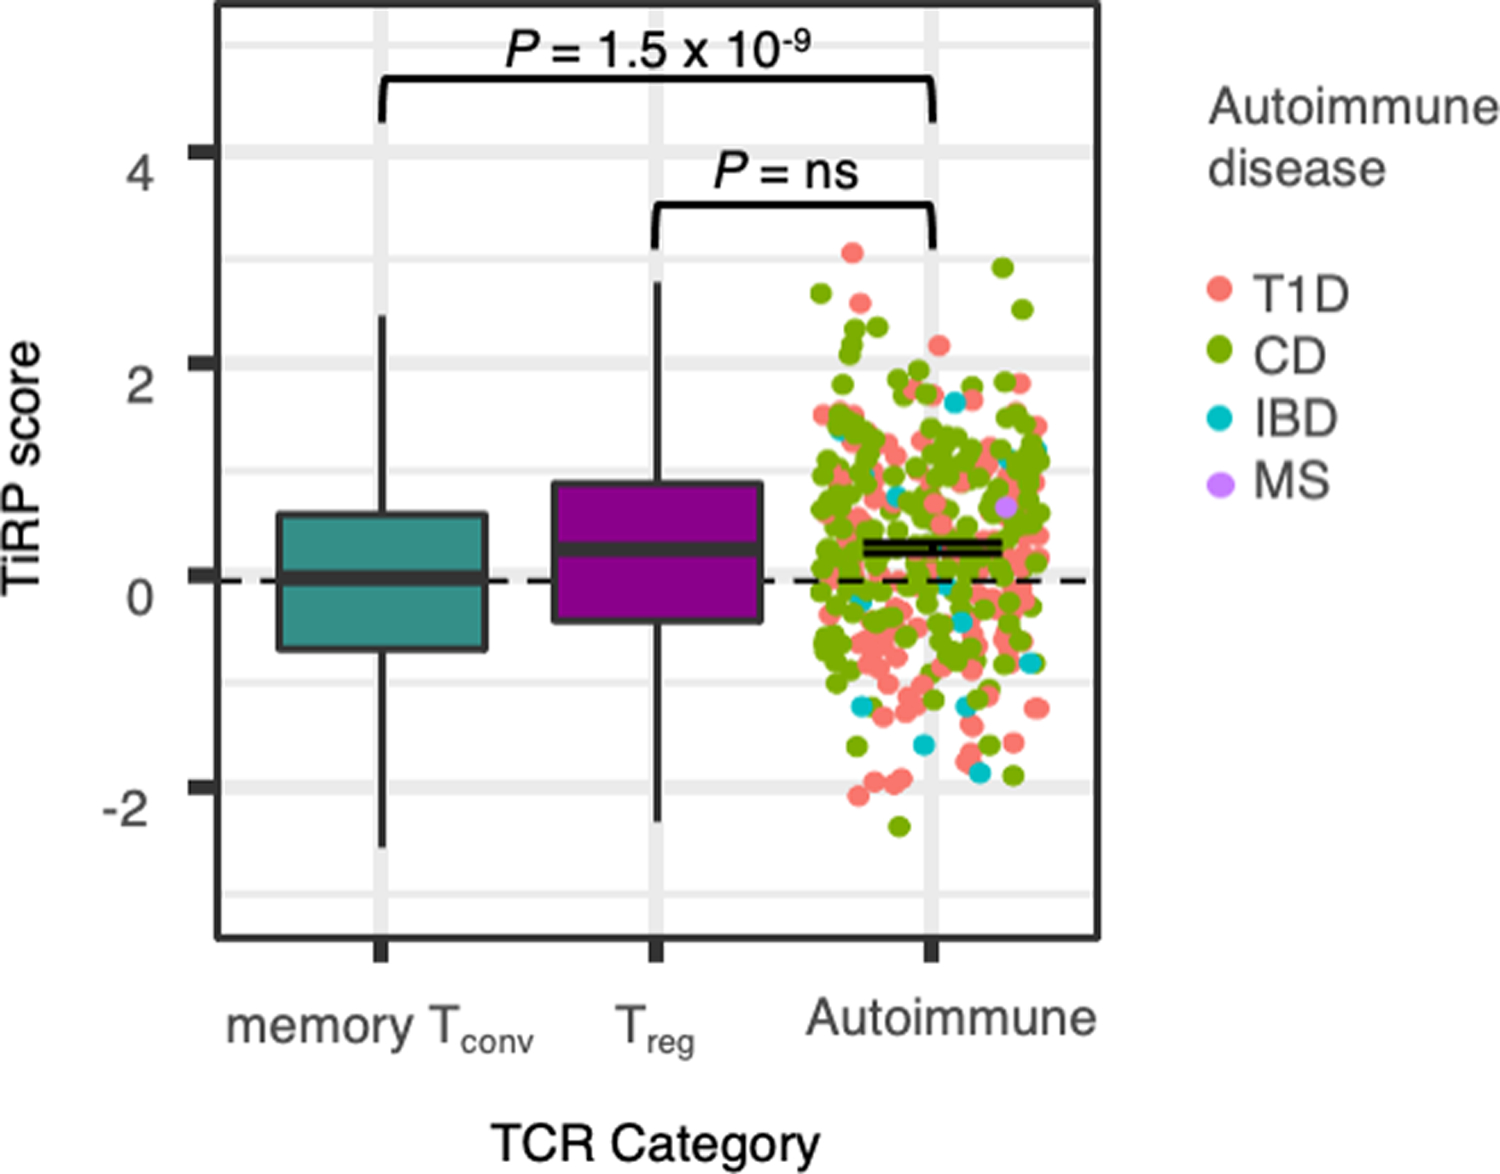
Extended Data Fig. 10: TiRP scoring of autoreactive T cell receptors.

TiRP scores of McPAS and VDJdb autoimmune TCRs (points) compared to memory Tconvs and Tregs from the replication dataset held out for testing (boxplots). Each point in the autoimmune category represents one TCR from McPAS or VDJdb. Error bar denotes standard error of the mean TiRP for autoreactive TCRs, which is higher than reference memory Tconvs (P = 1.5 × 10⁻⁹, two-sided Wald test), but not significantly different from reference Tregs (P = 0.43, two-sided Wald test). Within each boxplot, the horizontal lines reflect the median, the top and bottom of each box reflect the interquartile range (IQR), and the whiskers reflect the maximum and minimum values within each grouping no further than 1.5 × IQR from the hinge.
T1D = Type 1 Diabetes
CD = Celiac Disease
IBD = Inflammatory Bowel Disease
MS = Multiple Sclerosis
