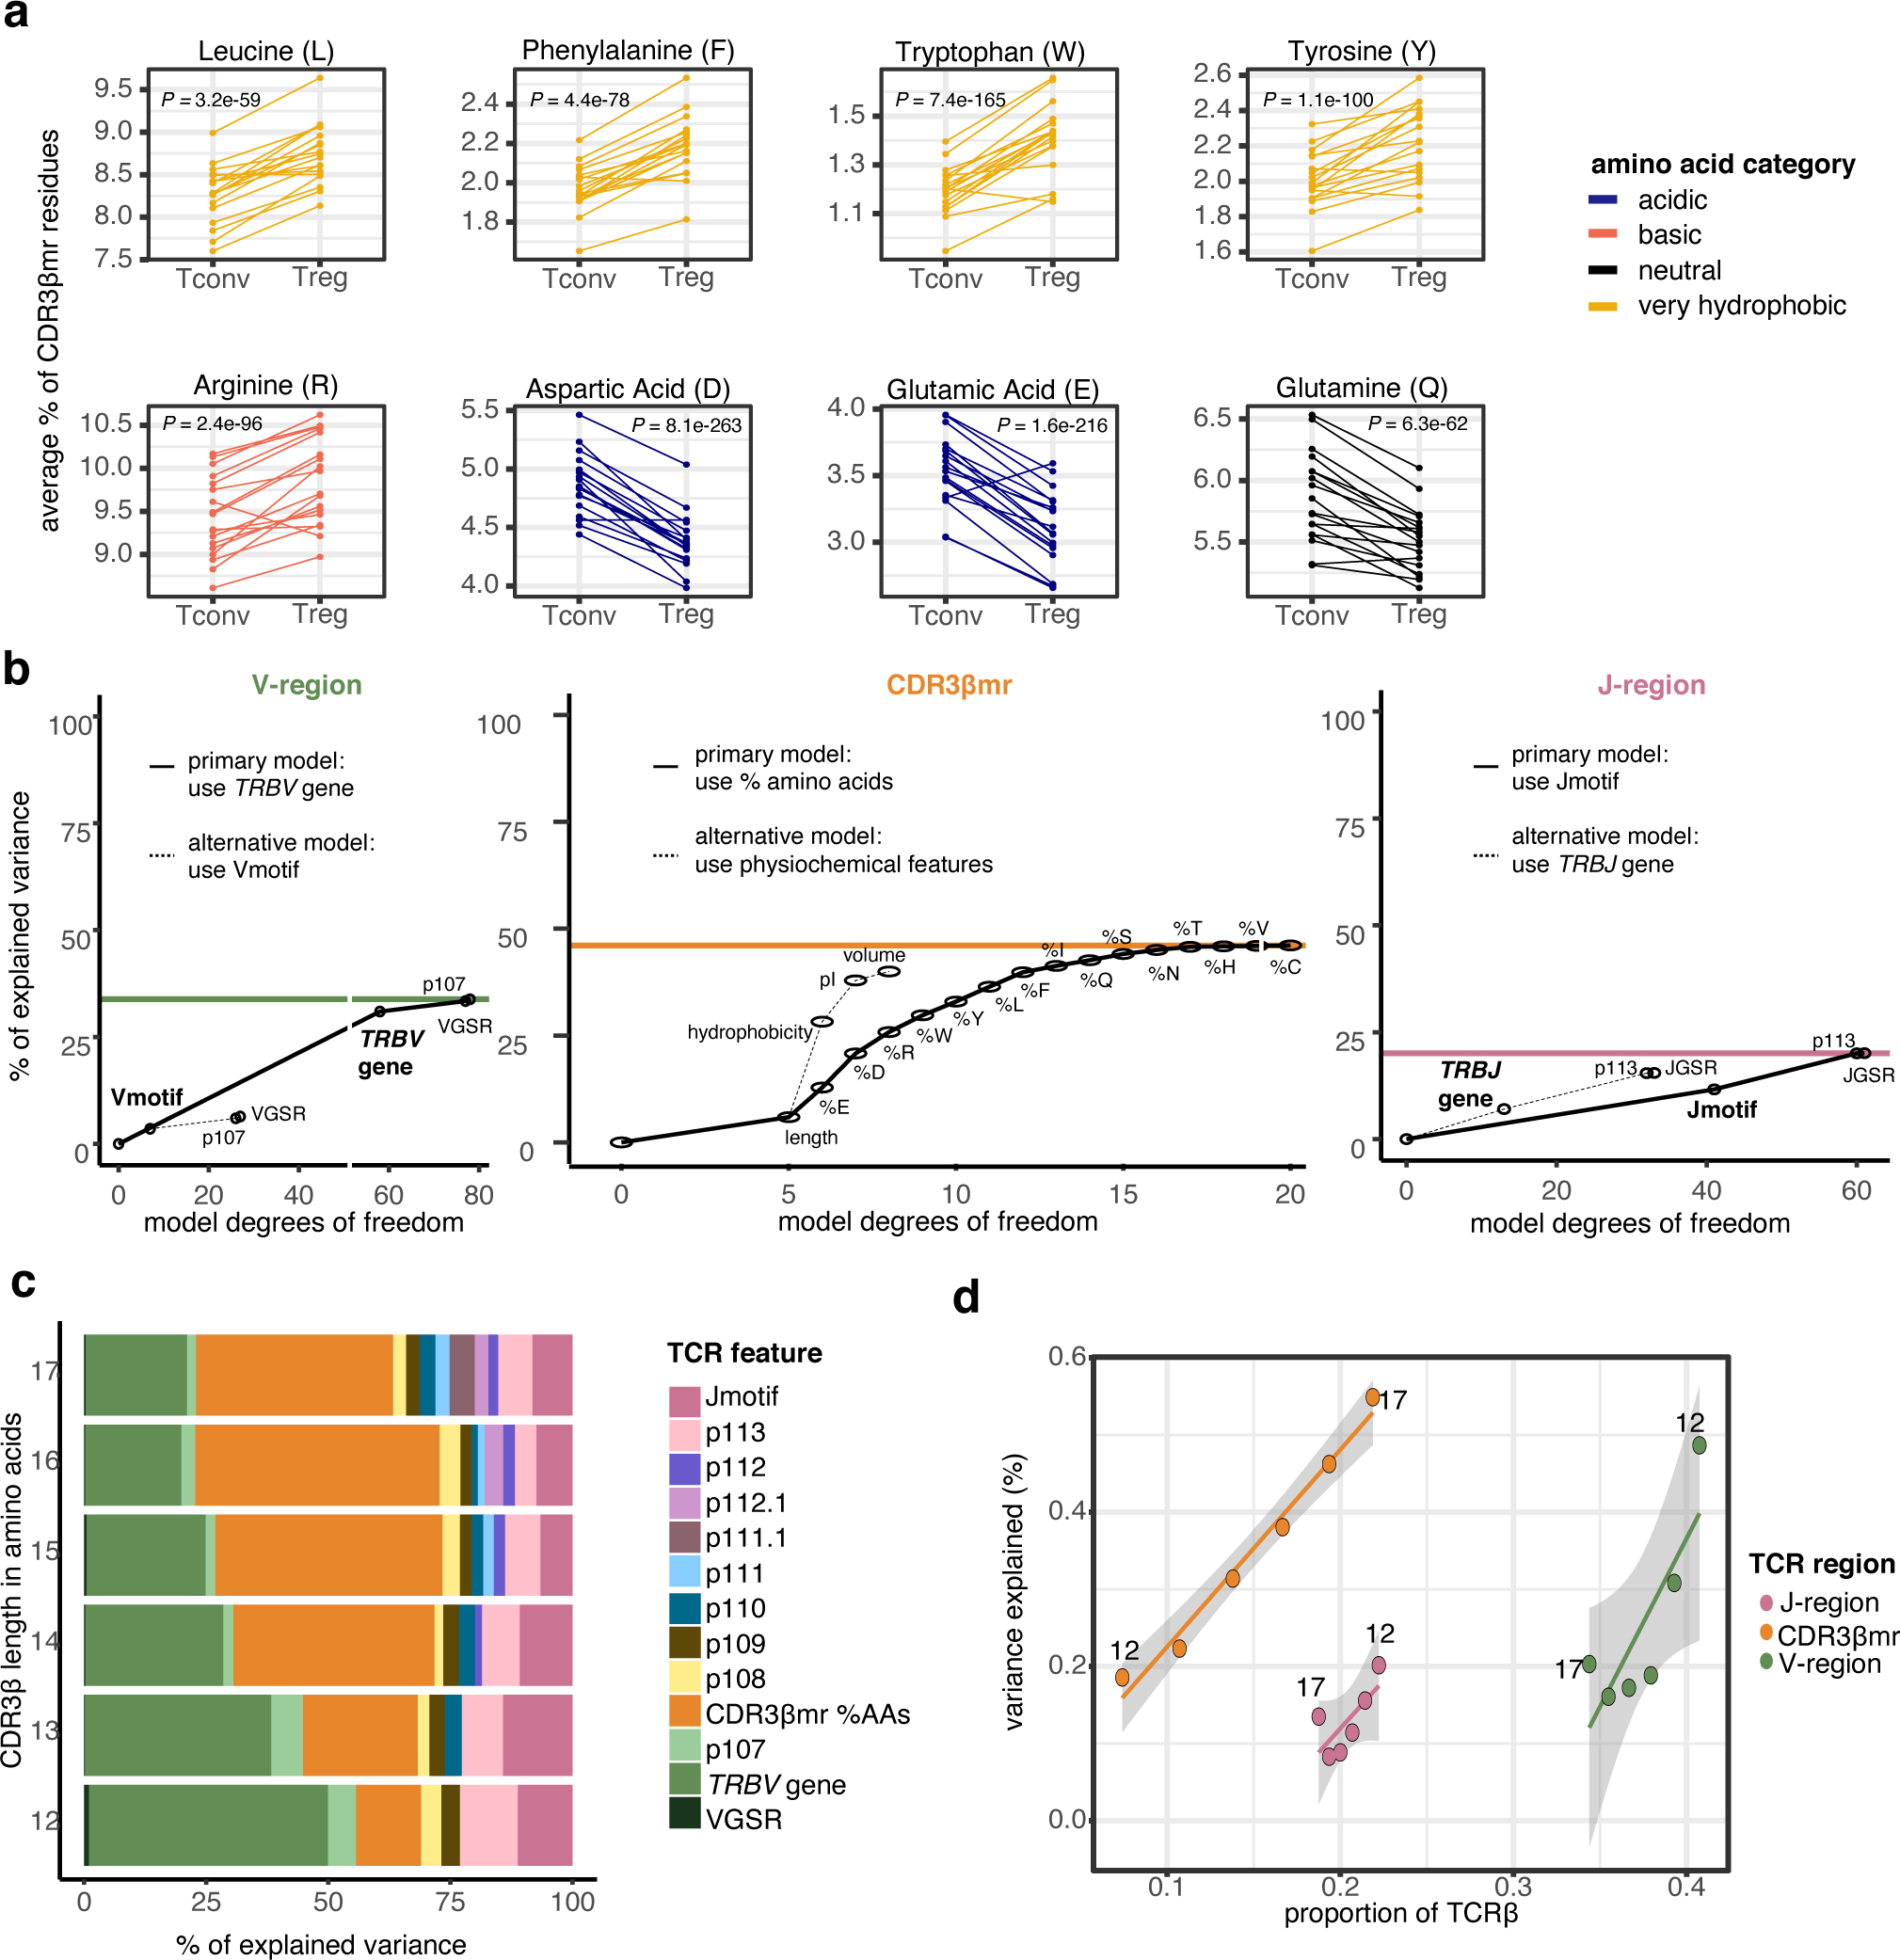
Figure 3. Broad differences exist between the TCRs of Tregs and Tconvs.

(a) Percentage of select amino acids in the CDR3βmr, plotted as the mean for each donor sample in the discovery cohort, separated by cell type and colored by amino acid groups. P values are computed by a two-sided Wald test on the coefficient for each amino acid term in a mixed effect logistic regression model (Methods). (b) Incremental variance explained by the addition of labeled TCR features to the V-region (left), CDR3βmr (middle), and J-region (right) mixed effect logistic regression models. The addition of each TCR feature increased model complexity by adding one degree of freedom for each quantitative feature and k - 1 degrees of freedom for each qualitative feature, where k is equal to the number of possible values for the qualitative feature (k = 58 for 58 possible TRBV genes; k = 8 for 8 possible Vmotifs). For each region, the primary modeling approach was compared to the alternative modeling approach, and the modeling approach that explained greater variance was selected. Colored horizontal lines depict the total percent of explained variance attributable to each TCR region, summing to 100%. (c) Percent of explained variance by each TCR feature type, summing to 100% for each length of CDR3β. (d) Variance explained by each TCR region for different CDR3β lengths. As CDR3β length increases, CDR3βmr occupies a greater proportion of the TCR (fraction of amino acid residues), at the expense of V and J region proportions. Line of best fit is drawn for each TCR region; 95% confidence interval shaded in gray, with each point is labeled by CDR3β length. X-axis corresponds to the proportion of TCR β chain amino acids derived from the V, J, and middle regions (summing to 100 for each CDR3β length, Methods), while the Y-axis corresponds to the absolute variance explained (scale: 0 −100%).
VGSR = V gene selection rate (Supplementary Note). CDR3βmr %AAs = percent composition of amino acids in the CDR3βmr.. VGSR = V gene selection rate (Supplementary Note). CDR3βmr %AAs = percent composition of amino acids in the CDR3βmr.
