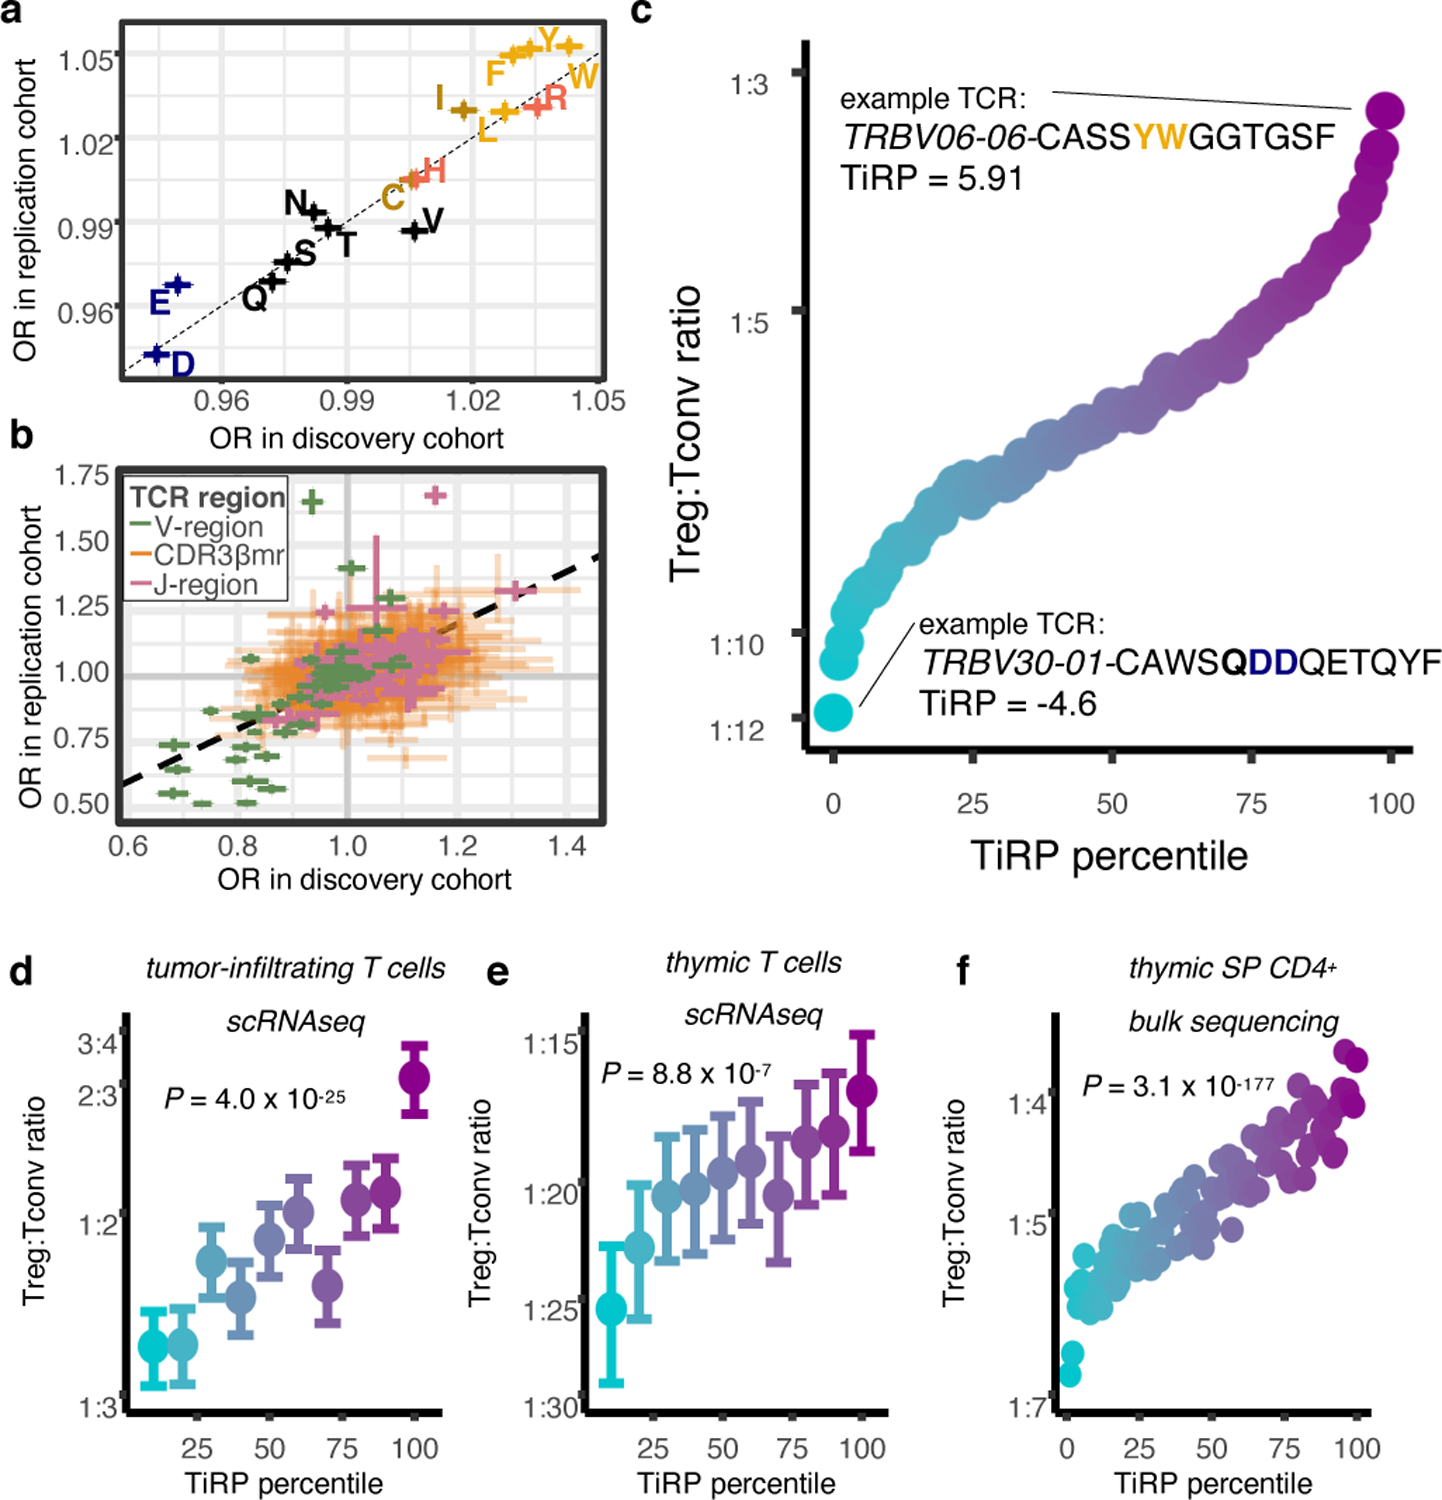
Figure 5. Treg TCR sequence biases replicate in independent cohorts.

(a) Correspondence between the discovery and replication cohort odds ratios for CDR3βmr compositional amino acids (AAs); OR corresponds to the change in Treg odds associated with one standard deviation (SD) increase in CDR3βmr percentage for a given AA. Colors for amino acids correspond to Extended Data Figure 1h. (b) Comparison in (a) for all other TCR sequence features; OR corresponds to the change in Treg odds associated with the presence of the given feature compared to the reference feature (Supplementary Table 1). For (a)-(b), R = Pearson’s correlation coefficient and P values are computed by a two-sided t-test with Fischer transformation. (c) Validation of the TCR-intrinsic regulatory potential (TiRP) score in held-out donors of the discovery and replication datasets (n = 3,277,036 TCRs). Each SD increase in TiRP was associated with a 23% increase in the odds of Treg status (OR: 1.231, 95% CI: 1.227 – 1.235, likelihood ratio test (LRT) P = 2.4 × 10−3248). Percentile points are colored by Treg:Tconv ratio ranging from blue (lowest) to purple (highest). (d) Validation of TiRP in scRNAseq of CD4+ tumor microenvironment T cells18,19 (n = 27,721 cells). Each unit increase in TiRP (corresponding to one SD for the scores in 5c) was associated with a 16% increase in the odds of Treg status (OR: 1.16, 95% CI: 1.13–1.19, LRT P = 4.0 × 10⁻²⁵). (e) Validation of TiRP in human thymic T cells13 (n = 60,424 cells). Among developing thymocytes, each unit increase in TiRP was associated with a 9% increase in the odds of Treg fate (OR: 1.09, 95% CI: 1.05 – 1.13, LRT P = 8.8 × 10⁻⁷). For (d) and (e), error bars outline 95% confidence intervals for Treg/Tconv odds in each TiRP score decile, computed by bootstrap resampling (Methods). (f) Validation of TiRP in TCR-targeted gDNA sequencing from grafted human thymi of humanized mice14 (n = 466,551 TCRs). Each unit increase in TiRP was associated with a 12% increase in the odds of Treg status (OR: 1.12, 95% CI: 1.11–1.12, LRT P = 3.1 × 10−177).
