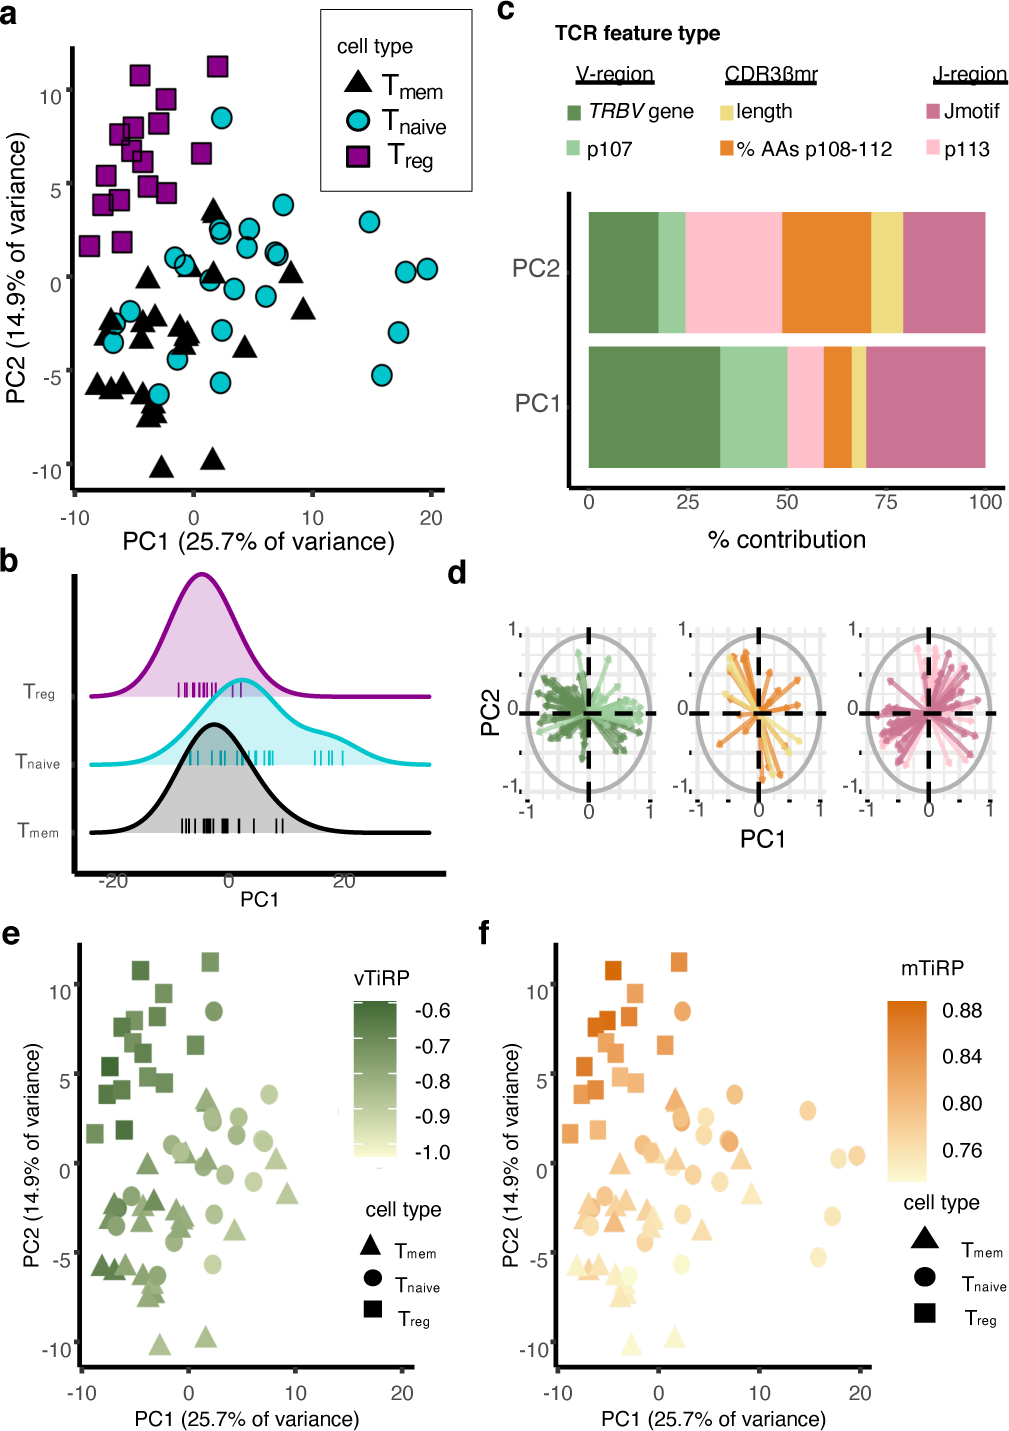
Figure 7. Two axes of TCR-driven cell states.

(a) 67 samples from the replication cohort colored by cell type and arranged by principal component space according to variation in TCR sequence feature frequencies (Methods). (b) Distribution of PC1 embeddings for each cell type; each vertical line corresponds to one sample. Naive Tconvs have the highest PC1 embedding in 15 of the 16 donors with all three cell types available. P value is computed by the binomial test with n = 16 and k = 15. (c) Percent contribution of each type of TCR sequence feature to the first two principal components. (d) Loadings of each of the TCR sequence features on PC1 and PC2, depicted by arrows, separated by TCR region and colored by the same scheme as in (c). (e) Samples arranged in PC space as in (a), colored by mean TiRP in the V-region of the TCR (vTiRP). (f) Same as in (e), colored by mean TiRP in the CDR3βmr (mTiRP). P values for (e)-(f) are calculated by a two-sided t-test with Fischer transformation on Pearson’s R.
jTiRP = TiRP (Treg-intrinsic regulatory potential) of the J-region of the TCR (IMGT positions 113–118)
mTiRP = TiRP (Treg-intrinsic regulatory potential) of the middle region of the TCR (IMGT positions 108–112)
vTiRP = TiRP (Treg-intrinsic regulatory potential) of the V-region of the TCR (IMGT positions 1–107)
