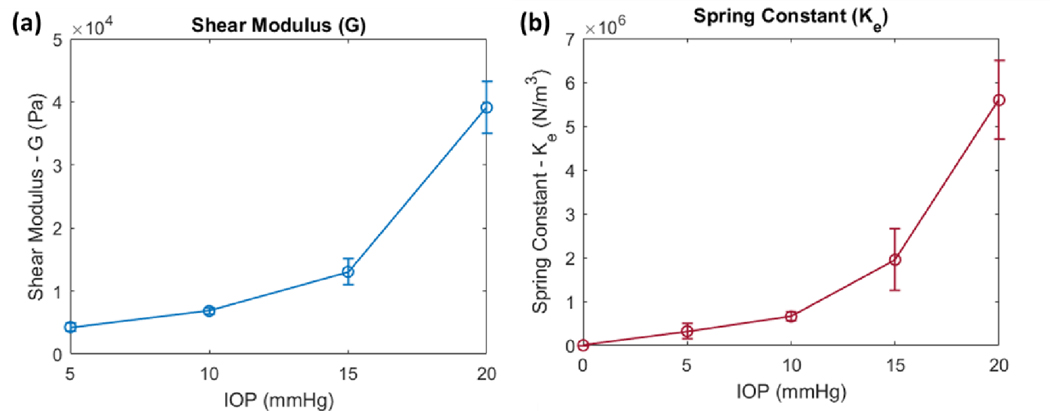
Figure 9. Parameters G and Ke obtained from fitting of the modified NITI model plotted as a function of IOP.
a) A small increase in the shear modulus G is seen from IOPs of 5–15 mmHg. A large jump is seen when IOP changes from 15 to 20 mmHg and may be due to nonlinear changes in the tissue. b) A small increase between Ke and IOP is seen between 0–15 mmHg; here, Ke was assumed to equal zero at no IOP. A large jump in Ke is observed at 20 mmHg. All values represent the mean ± SD, with a sample size of n = 3.

