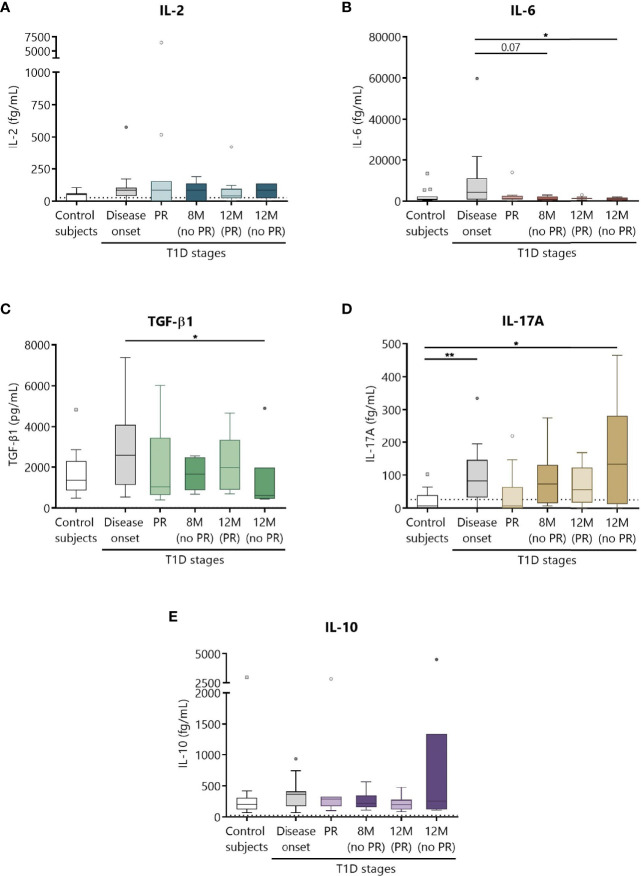
Figure 8.
Circulating cytokine concentrations at different stages of T1D. Plasma from control subjects and patients with T1D at different time-points was obtained to quantitatively determine the concentrations of (A) IL-2, (B) IL-6, (D) IL-17A, and (E) IL-10 by CBA and of (C) TGF-β1 by ELISA. Uncolored boxes represent controls (n = 17), and patients are represented by gray boxes at disease onset (n = 17), light-colored boxes at PR (n = 11) and for remitter patients at 12 months (12 M PR) (n = 10), and dark-colored boxes for non-remitter patients at 8 months (8 M no PR) (n = 6) and 12 months (12 M no PR) (n = 6). Data are presented as box-and-whisker plots. Boxes indicate the first and third quartiles. The horizontal bar in the box indicates the median. Whiskers are drawn using Tukey’s criteria of 1.5× the interquartile range. Outliers beyond the whiskers are shown. *P ≤ 0.05, **P <0.01 after mixed effects model with Tukey’s post-hoc test for longitudinal data, or Kruskal–Wallis with Dunn’s post-hoc test for comparisons between control subjects and the different T1D time-points. P ≤ 0.05 is considered significant.

