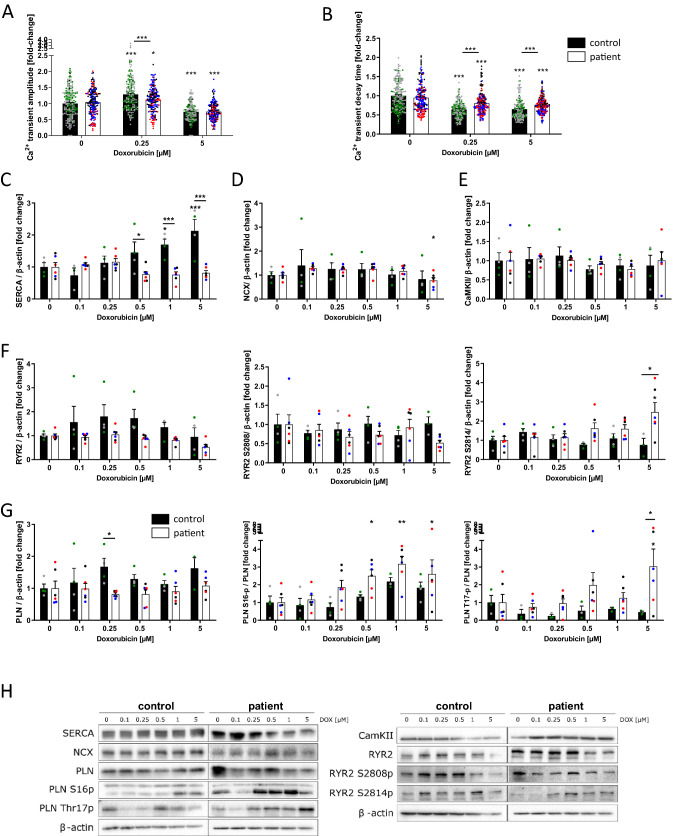
Fig. 6.
DOX disturbs Ca2+ homeostasis. A, B Effects of DOX (0.25 µM and 5 µM) on Ca2+ transient amplitude (A) and Ca2+ transient decay time (B) in iPSC CM of control and ACT patients. C–G DOX-induced relative changes in the amount of protein expression and phosphorylation of SERCA2a (C), NCX (D), CaMKIIδ (E), RYR2, RYR2-S2808, RYR2-S2814 (F), PLN, PLN-S16p, PLN-T17p (G) in iPSC CM of control and ACT patients after 24 h of DOX treatment. Different colored dots indicate the different control lines (green: control 1, grey: control 2) and patient lines (blue: ACT1, black: ACT2 and red: ACT3) used. H Representative Western blots of Ca2+-associated proteins in DOX-treated iPSC CM of control and ACT patients. Sample numbers: A, B 180 control-iPSC CM from 9 differentiations from 2 controls, 180 ACT patient-iPSC CM from 9 differentiations from 3 patients. C–G 4 control-iPSC CM differentiations, 6 ACT patient iPSC CM differentiations. Statistical analysis was performed using 2-way ANOVA with Dunnett’s multiple comparison test. Mean with SEM. *p < 0.05, **p < 0.01, ***p < 0.001. *Above single bars indicate statistical significances to untreated (0 µM DOX) conditions of the same group

