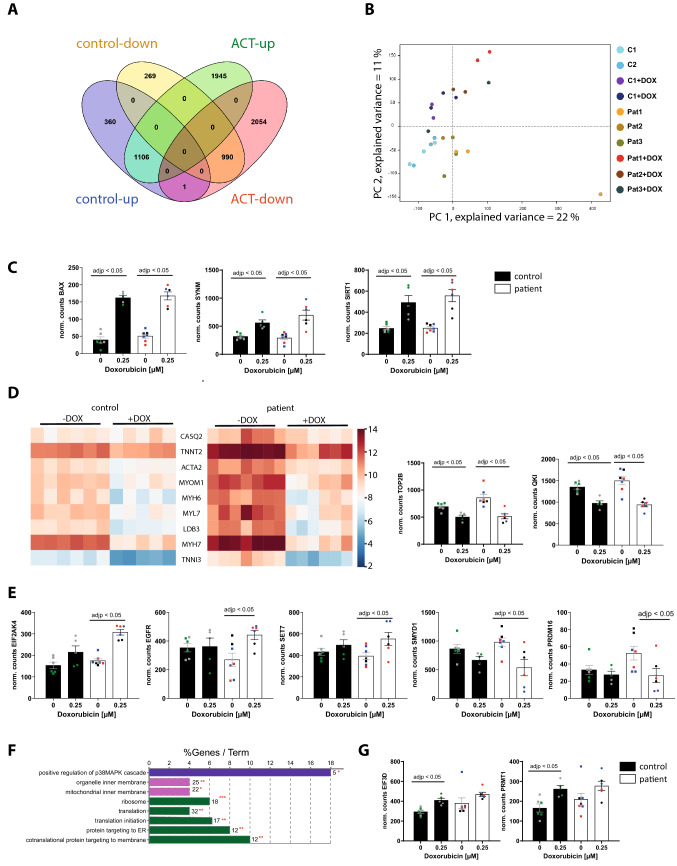
Fig. 8.
DOX-dependent differential gene expression in both ACT patient EHM and control EHM. A–F For control EHM, 5–6 independent EHM from 1 cell line of control patient 1 and 2, and for ACT patient EHM, 6–7 independent EHM from 1 cell line of each of the 3 ACT patients (ACT1, ACT2, ACT3) were analyzed. A DOX-induced differentially expressed genes (DEGs) in ACT patient EHM and control EHM compared to untreated conditions illustrated in a Venn diagram. B PCA plot of control and ACT patient EHM samples used for the analysis. C Normalized counts of DOX-dependent upregulated DEGs (BAX, SYNM, SIRT1). D Heat map of 9 structural genes that are significantly downregulated after DOX treatment in control and ACT patient EHM. Normalized counts of DOX-dependent downregulated TOP2B and QKI. E Normalized counts of ACT-specific, DOX-dependent upregulated DEGs (SET7, EIF2AK4, EGFR) as well as downregulated DEGs (SMYD1, PRDM16). F Significant enriched GO terms after DOX in control EHM compared to untreated conditions according to ClueGo Cytoscape plugin. The data of differential expression are based on all up-regulated genes. Data are generated by GO cellular component, GO biological process or KEGG pathway analysis. Terms of the same color correspond to terms containing a similar group of genes. The bars represent the number of the genes from the analyzed cluster that were found to be associated with the term, and the label displayed on the bars is the percentage of genes found compared to all the genes associated with the term. *p < 0.1; **p < 0.05 calculated based on hypergeometric distribution from Database for Annotation, Visualization and Integrated Discovery (DAVID, v6.7). G Normalized counts of control-specific, DOX-dependent upregulated DEGs (EIF3D, PRMT1)

