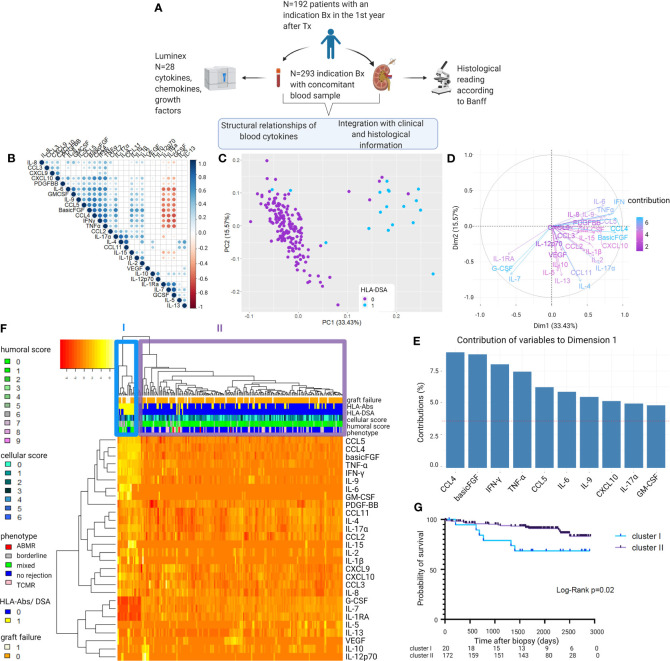
Figure 1.
Visualization of the structural relationships between blood protein levels and clinical and histological characteristics. (A) Study design. (B) Correlation matrix of the 28 proteins using Pearson correlations of the log10-transformed protein levels. Colors indicate correlation coefficient (ρ); dots indicate p-values (only p-values <0.05 are represented with a circle). Proteins are ordered as defined by hierarchical clustering. (C) Principal component analysis (PCA) of first biopsies per patient (N = 192) shows two clusters distinct in their 28 blood protein levels. Colors indicate the presence of HLA-DSA. (D) Contributions of the 28 cytokines to the principal component analysis. (E) Top 10 contributing cytokines to axis 1 of the principal component analysis (PC1). (F) Heatmap analysis of histological lesions and blood proteins of first biopsies per patient (N = 192). Reordering of dendrograms based on hierarchical clustering. Two distinct clusters, cluster I (N = 20) and II (N = 172) can be distinguished. (G) Kaplan–Meier survival curve illustrating survival probability for cluster I and II, counted from the day of the first biopsy (N = 192). ABMR, antibody-mediated rejection; TCMR, T cell-mediated rejection; HLA-DSA, anti-HLA donor-specific antibodies; HLA-Abs, anti-HLA antibodies. Mixed rejection was defined as ABMR concomitant with TCMR or borderline changes. All protein levels are log10 transformed. Humoral score = sum of glomerulitis; peritubular capillaritis, intimal arteritis and C4d deposition in the peritubular capillaries. Cellular score = sum of tubulitis, interstitial inflammation, and intimal arteritis.

