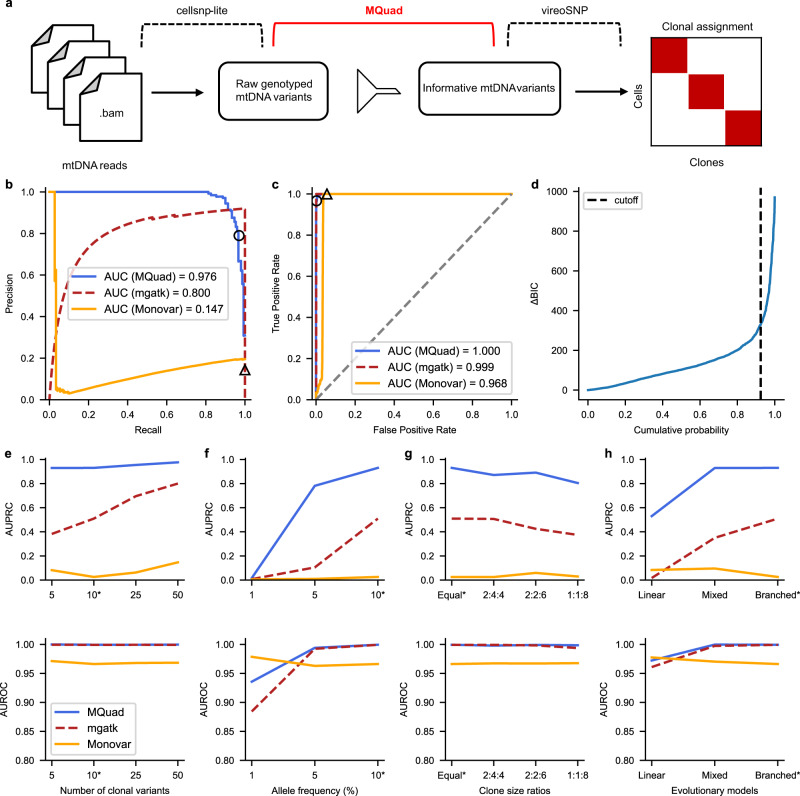
Fig. 1. Overview of analysis pipeline and benchmark with simulated data.
a Schematic for tailored analysis suite recommended to use alongside MQuad. Precision-Recall (PR) curve (b) and Receiver Operating Characteristic (ROC) curve (c) for the detection of simulated variants in a simulation with all default settings (see Methods) except 50 clonal variants per clone. Curve is generated by varying the cutoff on ΔBIC in MQuad, VMR in mgatk, and MPR in Monovar. Black circle and triangle represent the default thresholds used to classify informative variants for MQuad and mgatk respectively. The threshold for Monovar is not shown because there is no default threshold suggested. d Cumulative distribution function of ΔBIC with cutoff shown, based on the same data in b, c. Changes in area under PR curve (AUPRC) and area under ROC curve (AUROC) when varying (e) number of variants per clone, (f) allele frequency of clonal variants, (g) clone sizes, (h) evolutionary models. Asterisk indicates the default parameter.

