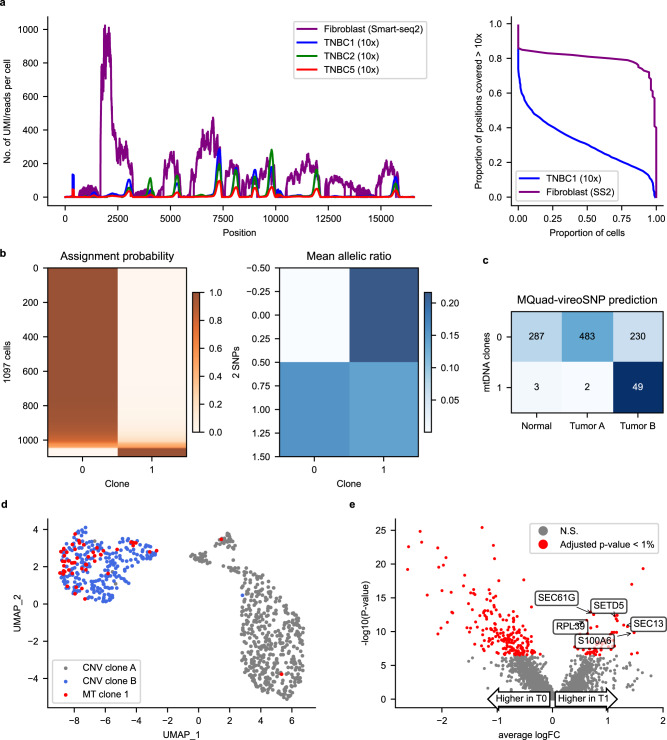
Fig. 5. Analysis of mtDNA variants on 10x scRNA-seq datasets.
a Coverage comparison between 3 TNBC 10x scRNA-seq datasets and fibroblast Smart-seq2 dataset. UMI-based scRNA-seq shows uneven distribution of reads across the mitochondrial genome while Smart-seq2 is generally more well-covered. b Clonal assignment and mean allelic ratio of 1097 cells from TNBC1. c Confusion matrix between CNV subclones and confidently assigned mitochondrial clones. d UMAP plot with tumor cells only. Mitochondrial clone 1 highly overlaps with CNV clone B. e Volcano plot showing negative log10 P-values (Seurat FindMarkers with DESeq2 model; two-sided Wald test) against average log2 fold changes (FC) for DE between T0 (Tumor & MT0) and T1 (Tumor & MT1). Significant DE genes (Adjusted p-value < 0.01) highlighted in red. DE genes that are associated with breast cancer are labeled.

