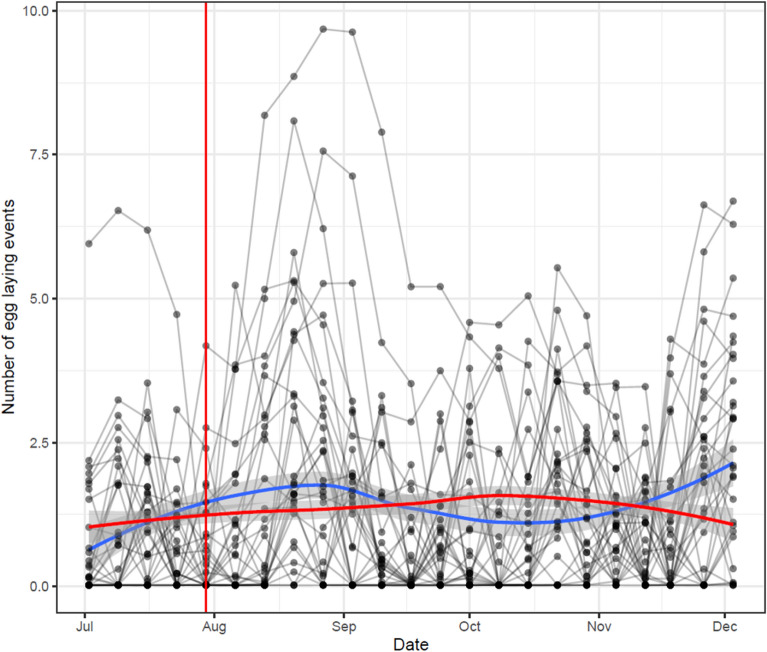
Figure 4.
The inferred number of egg laying events in the index ovitraps in the Treatment blocks. The inferred number of egg-laying events over time for each index ovitrap in the Treatment blocks are plotted as lines. The index ovitraps were measured for 3 weeks before additional ovitraps were placed in the Treatment blocks (therefore increasing the number of removed eggs in those blocks). The red vertical line indicated the time at which new ovitraps were placed. The red and blue horizontal lines represent the loess curves for the index ovitraps in the Treatment block and the ovitraps in the combined control group (Control and Vector blocks), respectively.

