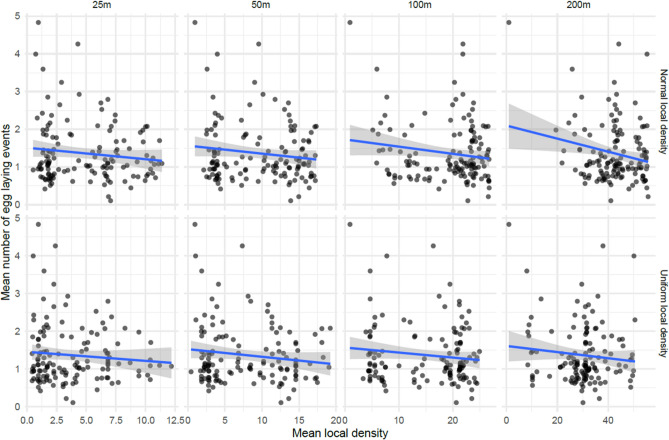
Figure 7.
Mean Number of inferred egg laying events and the mean local density of ovitraps in the previous week over the course of the study. This plot shows the mean number of inferred egg laying events by the mean local density of ovitraps in the previous week for all ovitraps. The rows correspond to the Normal and Uniform local density models and the columns give the distance parameter for those models. The x-axis can be loosely interpreted as the number of other ovitraps that are within about the specified number of meters of the given ovitrap. The blue line shows the predicted mean of the linear model of the data.

