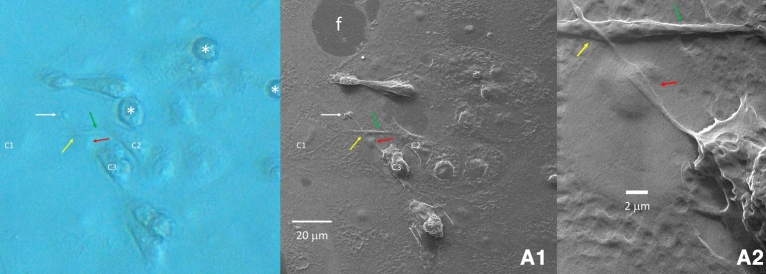
Figure 5.
TNT overlap. An area of 130-micron square has been imaged (A1) that shows a TNT originating from cell C3 overlapping another TNT which connects cells C1 and C2 (green arrow). A region shows the bare floor of the culture well (f). TNT keep their individual structure when they cross each other (yellow arrow), but they may fuse their membrane when they overlap a cell (red arrow) (magnification in (A2)). The specific morphology often seen in a TNT polymorphic bulged termination is pointed by a white arrow. Correlation with a phase contract image taken before HeIM (left) shows three rounded infected cells detached from the floor (asterisks) that were no longer present in the subsequent HeIM photomicrograph.

