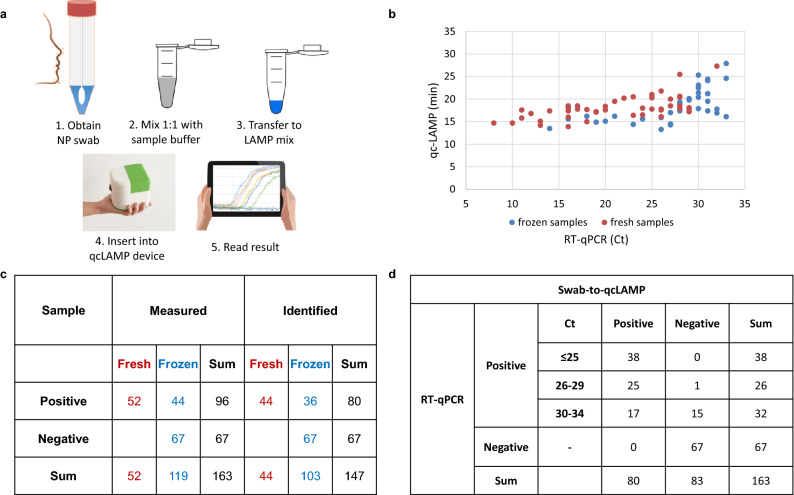
Figure 5.
(a) Schematic representation of the workflow of the SARS-CoV-2 swab-to-qcLAMP detection, i.e. without RNA purification. (b) Scattered plot of the Ct values of PCR-confirmed positive samples by using the HNB colorimetric dye inside the LAMP-mix. (c) Table presenting overall diagnostic sensitivity and specificity of the qcLAMP for fresh and frozen samples; the red and blue colors are used to guide the eye and depict fresh and frozen samples, respectively. (d) when considering various Ct cut off values. For Ct < 30 sensitivity becomes 98% (95% CI: 95–101) and negative likelihood ratio 0.016 (95% CI: 0.002–0.109); for Ct < 25, sensitivity is calculated to be 100%.

