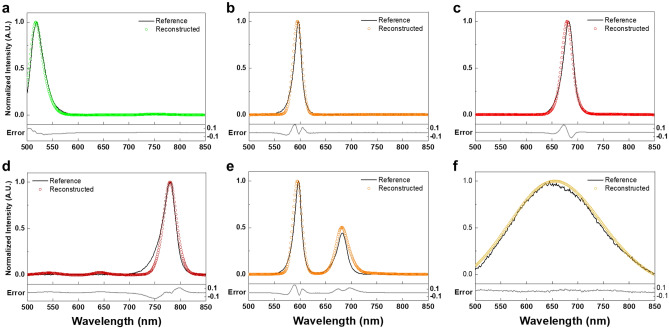
Figure 5.
Spectral reconstructions of LEDs and a halogen light source. (a) a green LED, (b) an orange LED, (c) a red LED, (d) an infrared LED, (e) Combined two LEDs (orange and red), and (f) a halogen light source. Solid black lines represent reference spectra which are measured by the grating-based spectrometer. Colored circles represent reconstructed spectra using the MTF filter array spectrometer. Solid light gray lines represent error between reconstructed and reference spectra.

