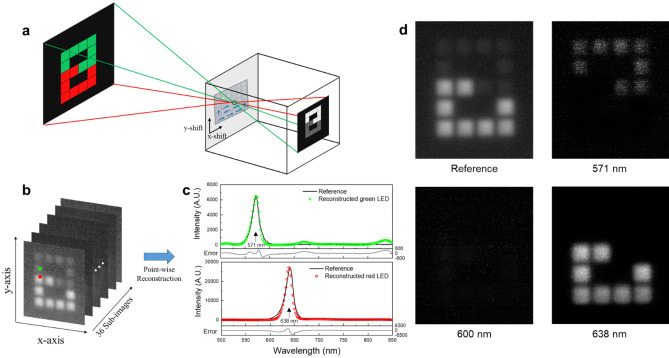
Figure 6.
Computational pinhole spectral imaging. (a) Schematic of pinhole imaging; The MTF filter array is placed in front of the pinhole camera. A single filter is adjusted to the pinhole and the filtered image is acquired. By changing filters, 36 filtered images are obtained. (b) 36 filtered images of 8 × 8 LED matrix showing the number “8”. The upper part consists of green LEDs and the lower part consists of red LEDs. (c) Point-wise spectral reconstruction: a pixel of a green LED block and a red LED block which are denoted in (b). Solid light gray lines represent error between reconstructed and reference. (d) Monochrome image of reference and reconstructed monochrome images at 571, 600 and 638 nm, respectively.

