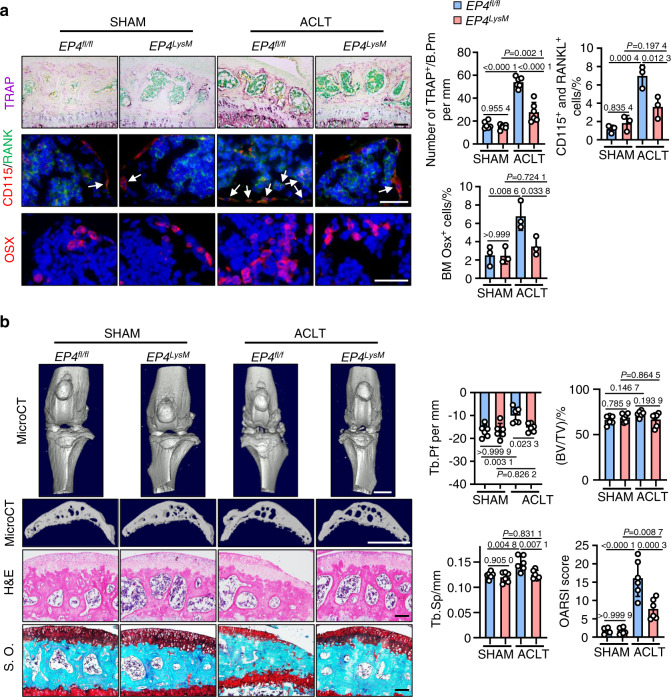
Fig. 2.
EP4 deletion in osteoclasts inhibits OA progression in a murine OA model. a Representative images of TRAP staining and IHF staining of Osterix (Osx), CD115 (red), and RANK (green) in the subchondral bone of the EP4fl/fl or littermate EP4LysM mice post-ACLT surgery (top) and quantitative analysis (bottom). TRAP staining, IHF staining of CD115 and RANK, and IHC staining of Osx were performed 2 weeks after ACLT surgery. The white arrow indicates CD115 and RANK double-positive osteoclast precursors. Error bars are the mean ± s.d. Two-way ANOVA followed by Tukey’s t tests. n = 6 for TRAP staining, n = 3 for CD115 and RANK IHF staining. Scale bars, 50 μm (TRAP staining), 20 μm (CD115 and RANK IHF staining), and 20 μm (Osx IHF staining). b Representative 3D reconstructed microCT images, H&E staining, and safranin O-fast green (S.O.) staining of sagittal sections of articular cartilage of the EP4fl/fl or littermate EP4LysM mice 8 weeks after ACLT surgery (left). Quantitative analysis of structural parameters of subchondral bone, including Tb.Pf, Tb.Sp and BV/TV. OARSI scores based on the S.O. staining histology analysis (right). Error bars are the mean ± s.d. n = 6 for each group. Two-way ANOVA followed by Tukey’s t tests. Scale bars, 1 mm (microCT), 50 μm (S.O.) and 50 μm (H&E)

