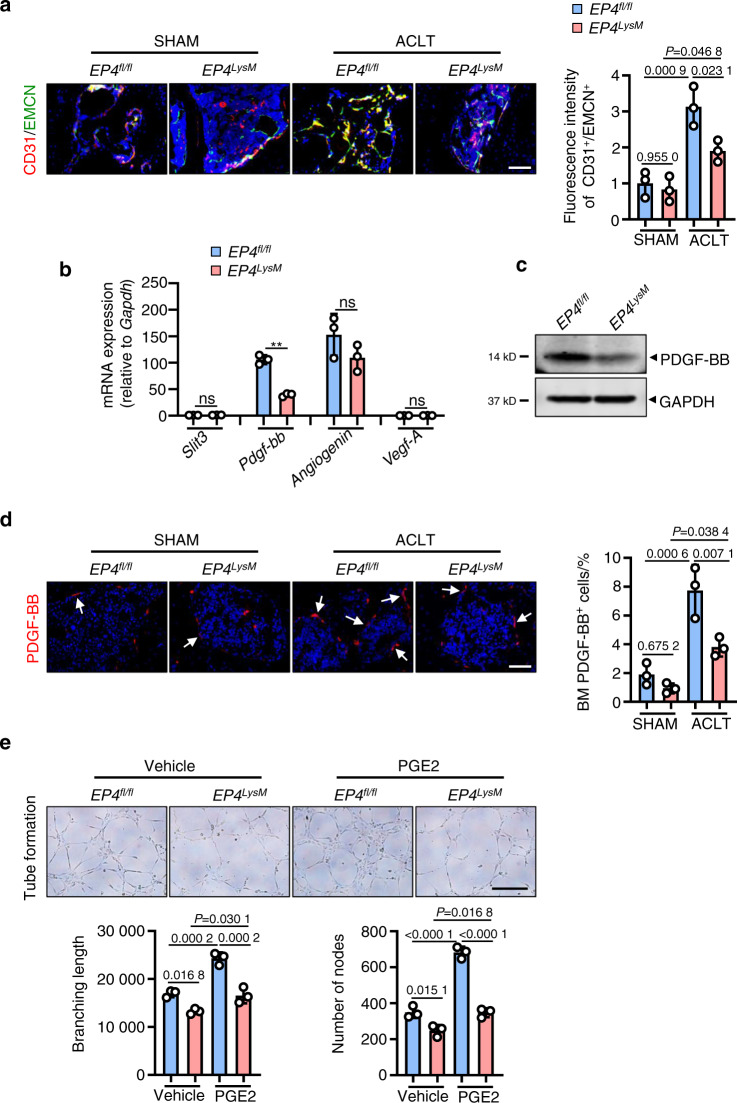
Fig. 4.
EP4 deletion in osteoclasts reduces type H blood vessels in subchondral bone via inhibition of PDGF-BB secretion. a Representative images for IHF staining of EMCN (green) and CD31 (red) in subchondral bone of the EP4fl/fl or littermate EP4LysM mice 2 weeks after ACLT surgery (left) and corresponding quantitative analysis (right). Error bars are the mean ± s.d. Two-way ANOVA followed by Tukey’s t tests. n = 3 for each group. Scale bars, 20 μm. b qRT-PCR analysis of the mRNA levels of Slit3, Pdgf-bb, Angiogenin, and Vegf-A in osteoclasts generated from BMMs of the EP4fl/fl or littermate EP4LysM mice stimulated with 10 ng·mL−1 M-CSF and 50 ng·mL−1 RANKL and incubated with 100 nmol·L−1 PGE2 for 24 h. Error bars are the mean ± s.d. n = 3. **P < 0.01 and ns, not significant by one-way ANOVA followed by Tukey’s t tests. c Representative images of PDGF-BB protein expression by western blotting of osteoclasts generated using BMMs from the EP4fl/fl or littermate EP4LysM mice stimulated with 10 ng·mL−1 M-CSF and 50 ng·mL−1 RANKL and incubated with 100 nmol·L−1 PGE2 for 3 days. The experiments were performed with three biological replicates. d Representative images of IHF staining of PDGF-BB (red) in the subchondral bone of the EP4fl/fl or littermate EP4LysM mice 2 weeks after ACLT surgery (left) and corresponding quantitative analysis (right). The white arrows indicate PDGF-BB IHF signals. Error bars are the mean ± s.d. Two-way ANOVA followed by Tukey’s t tests. n = 3 for each group. Scale bars, 20 μm. e Representative images of the HUVEC tube formation assay (left). BMMs isolated from the EP4fl/fl or littermate EP4LysM mice were stimulated with 10 ng·mL−1 M-CFS, 60 ng·mL−1 RANKL and 100 nmol·L−1 PGE2 for 3 days. Subsequently, conditioned medium from osteoclasts was used to treat HUVECs for 4 h. The branching length and node numbers of the HUVEC tubes were quantitated (right). Error bars are the mean ± s.d. n = 3. Two-way ANOVA followed by Tukey’s t tests. Scale bars, 50 μm

